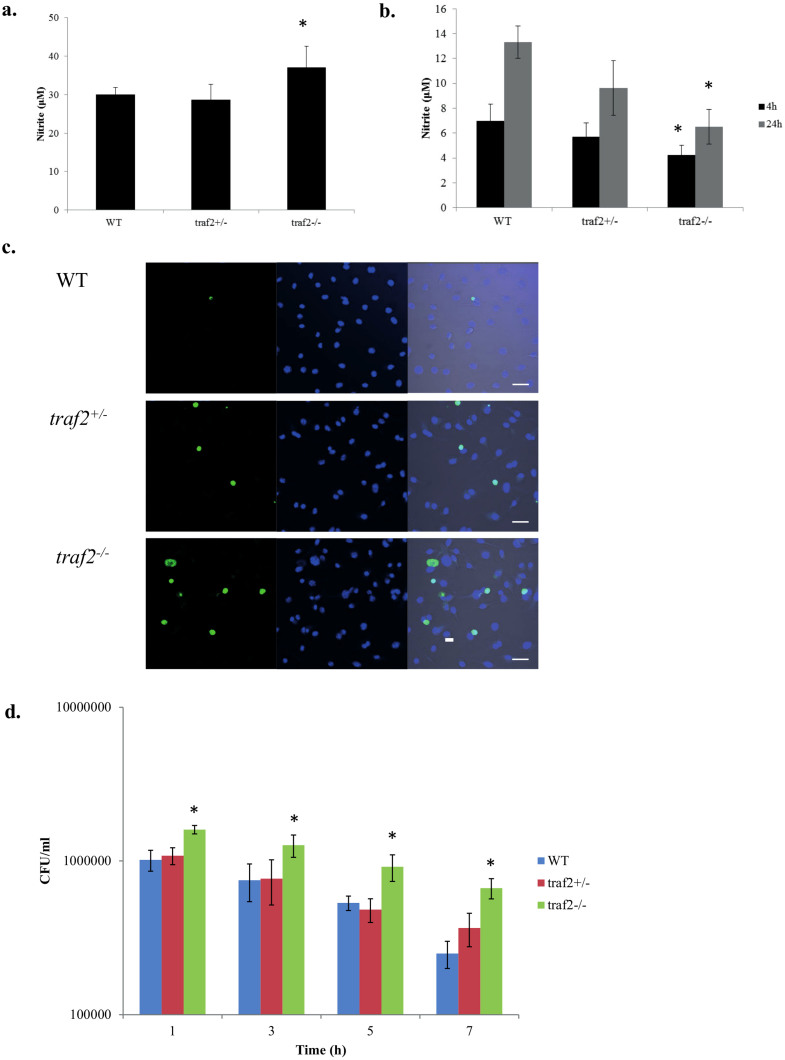
Figure 5. Responses to TNFα and LPS stimulation, and to S. Typhimurium infection of WT, traf2+/−, and traf2-/- ESDM.
Production of nitrite in culture supernatants after (a) 24 h TNFα stimulation, (b) 4 and 24 h LPS stimulation. (c) Cells were labelled by TUNEL to detect apoptotic cells (green in left panels) and stained with DAPI to detect nuclei (blue in middle panels). Right panels merged images. Scale bars 40 μm. (d) Bacterial cell counts enumerated from S. Typhimurium-infected ESDM at various time points. * represent statistically significant difference (P < 0.05) between WT and traf2-/- mutant as determined using two-way ANOVA. Equal numbers of WT and mutant cells were seeded for the various stimulation experiments.

