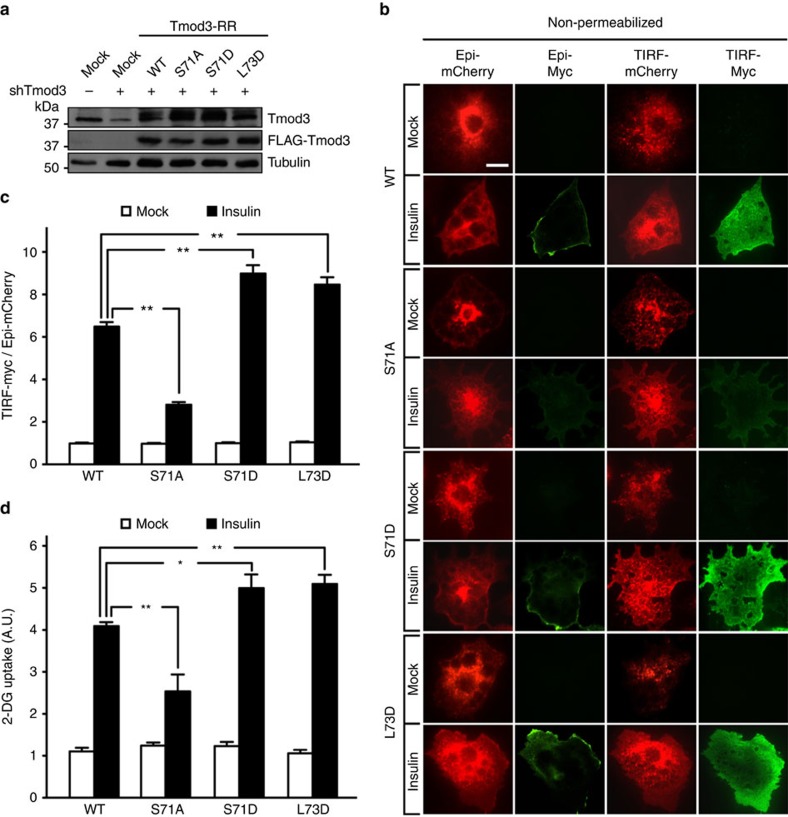
Figure 4. Phosphorylation of Tmod3 promotes insulin-stimulated GLUT4 exocytosis and glucose uptake in adipocytes.
(a) Western blots showing the expression levels of endogenous Tmod3 and overexpressed FLAG-Tmod3 variants in adipocytes. (b,c) Phosphomimetic Tmod3-S71D potentiates, while phosphodefective Tmod3-S71A inhibits GSVs fusion with PM. Insulin-stimulated GLUT4 insertion was examined by TIRF-based Myc-GLUT4-mCherry assay under non-permeabilized conditions. The ratio of cell surface TIRF-Myc signal to total Epi-mCherry signal is presented as mean±s.e.m. of about 100 cells in each group from three independent experiments (analysis of variance (ANOVA) with Dunnett’s multiple comparison test). **P<0.01 versus WT insulin groups. Representative TIRF images are shown in b. Scale bar, 20 μm. (d) Effects of Tmod3 variants on glucose uptake in adipocytes. After 3-h serum starvation, cells received mock or insulin treatment for 20 min for measurements of 2-DG uptake (n=4; ANOVA with Dunnett’s multiple comparison test). *P<0.05, **P<0.01 versus WT insulin groups.

