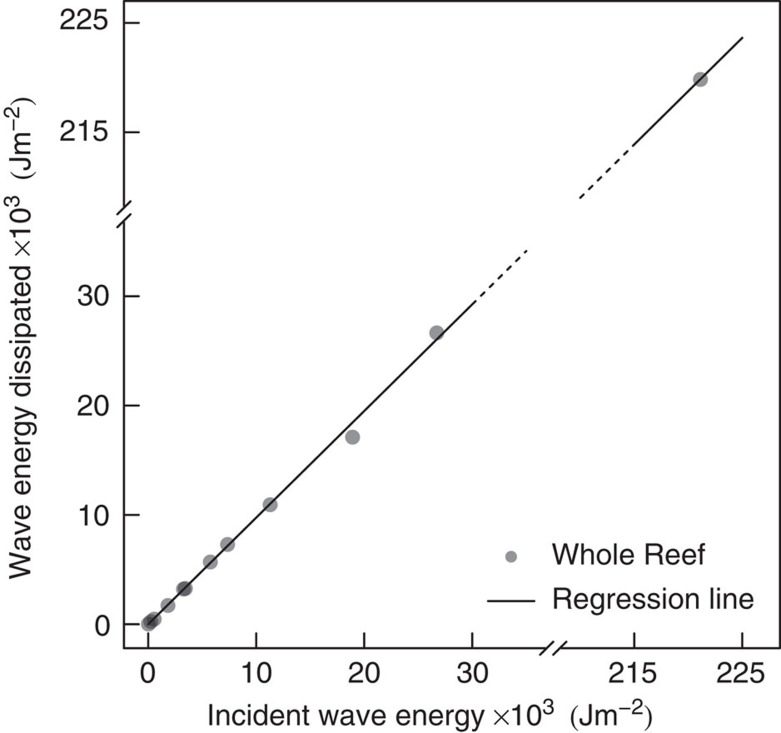
Figure 4. Wave energy dissipated across the whole reefs as a function of maximum incident wave energy.
Only experiments for which data were available in J m−2 were used (n=12). Trend line for the linear regression is (y=0.97x; R2=0.9). Both the x axis and the trend line have been broken to help the display the relationship across the full range of incident wave energy.

