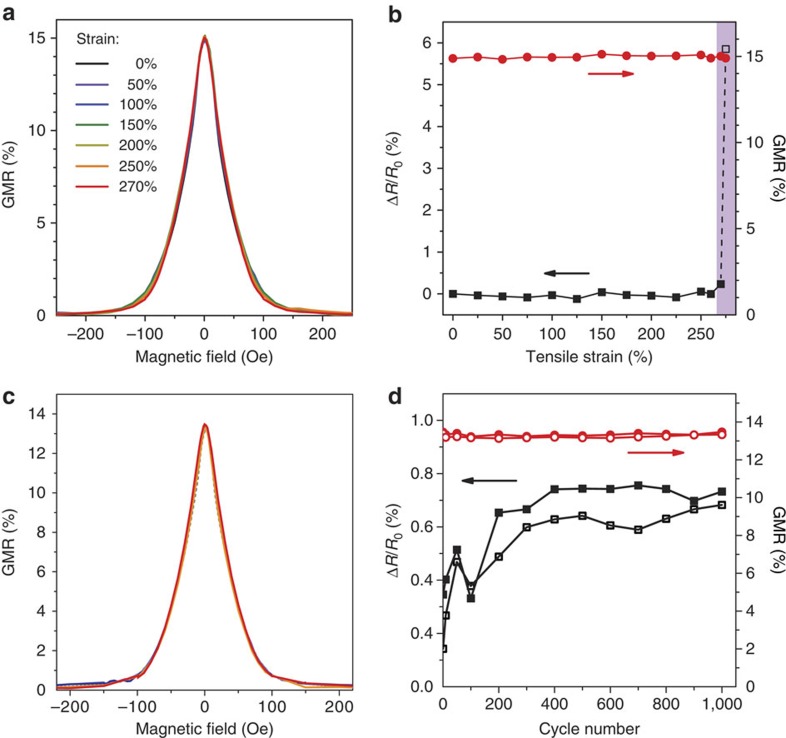
Figure 3. Results of stretching experiments.
(a) GMR curves recorded for strains from 0% to 250% in increments of 50%, plus 270%. (b) GMR magnitude (red dots) and resistance change normalized to 0% strain (black squares, R0=9.7 Ω) as a function of applied strain. The shaded region indicates overstretching with plastic deformation of the sensor foil. Reliability on cyclic loading. (c) GMR curves of a Py/Cu second maximum element at 50% strain (blue) and 100% strain (red); first cycle in light shades, cycle 1,000 in strong shades. The characteristic of the as-prepared sample is plotted in dashed grey. (d) GMR magnitude (red dots) and resistance change normalized to the as-prepared sample (black squares, R0=10.0 Ω) at 50% strain (open symbols) and 100% strain (closed symbols) as a function of cycle number.

