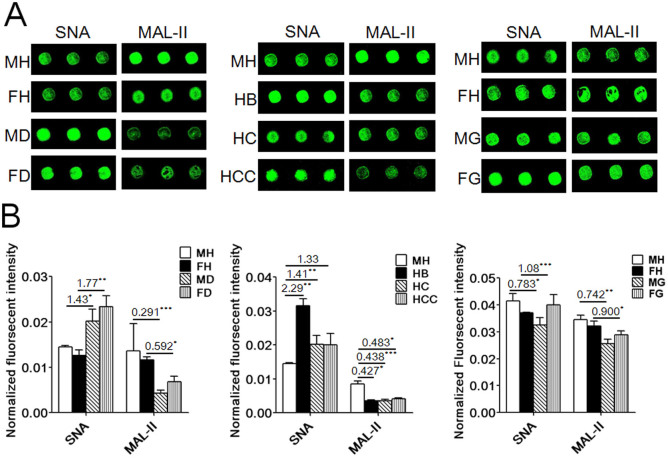
Figure 1. Relative expression levels of the terminal Siaα2-6Gal recognized by SNA and Siaα2-3Gal recognized by MAL-II in human saliva using lectin microarrays.
MH: male healthy groups, FH: female healthy groups, MD: male T2DM patients, FD: female T2DM patients, HB: hepatitis B, HC: hepatic cirrhosis, HCC: hepatocellular carcinoma, MG: male GC patients, FG: female GC patients. (A) Fluorescent images from a portion of SNA and MAL-II with three replicates. (B) Normalized fluorescent intensity of SNA and MAL-II from each clinical group compared with healthy groups based on the values of the ratio in pairs (*P < 0.05, **P < 0.01, and ***P ≤ 0.001).

