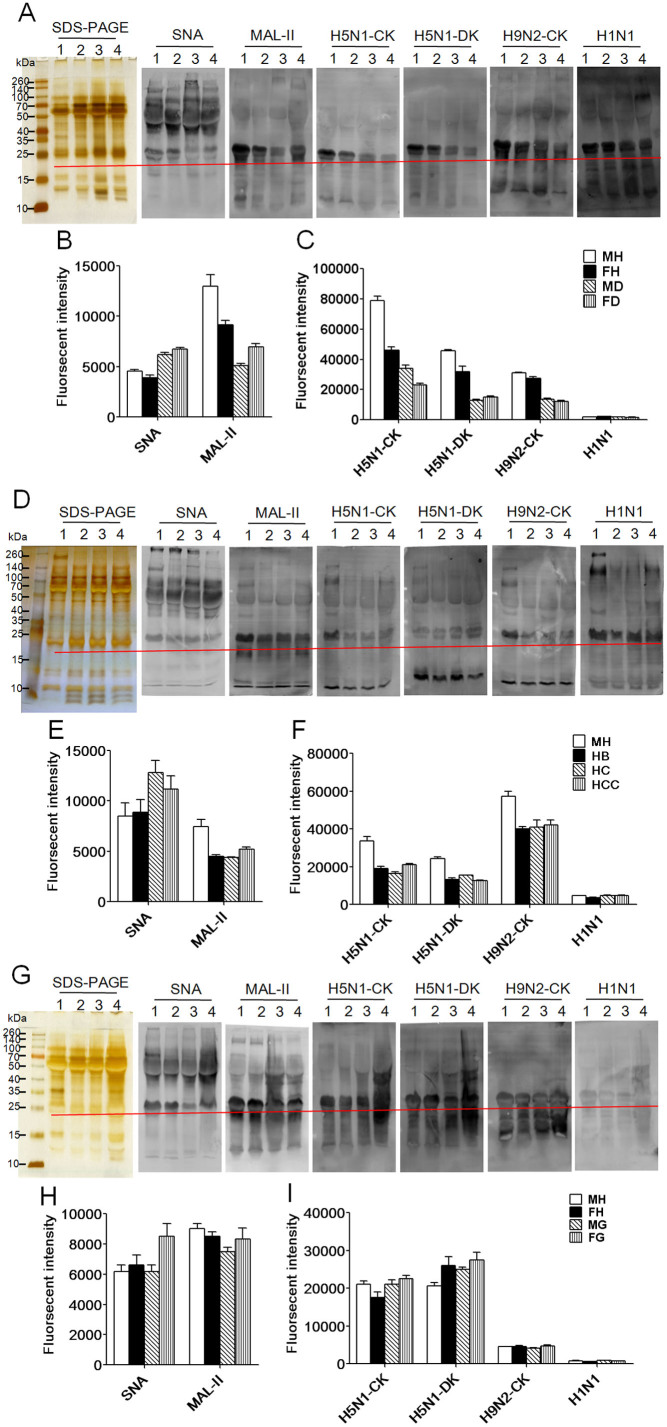
Figure 3. Validation of the terminal Siaα2-6Gal recognized by SNA and Siaα2-3Gal recognized by MAL-II in all salivary groups and a comparison of the binding pattern profiles of all salivary groups against three IAV strains A/Chicken/Guangxi/4/2009(H5N1), (A/Duck/Guangdong/17/2008(H5N1), A/Chicken/Fujian/S-1-521/2008(H9N2)) and the H1N1 influenza A vaccine.
The summed fluorescence intensities (SFIs) of the bands marked by red lines at approximately 25 kDa for all salivary groups from lane 1 to lane 4 were read by ImageQuant Tools. (A) Lane 1: male healthy group (MH); lane 2: female healthy group (FH); lane 3: male T2DM patients (MD); lane 4: female T2DM patients (FD). (B) The summed fluorescence intensities for SNA and MAL-II strains binding to samples from the T2DM salivary group. (C) The SFIs of the bands marked by red lines at approximately 25 kDa for three IAV strains and the H1N1 vaccine strains binding to the salivary protein samples from the T2DM group. (D) Lane 1: MH; lane 2: hepatitis B (HB); lane 3: hepatic cirrhosis (HC); lane 4: hepatocellular carcinoma (HCC). (E) The SFIs of the bands marked by red lines at approximately 25 kDa for SNA and MAL-II strains binding to the salivary protein samples from the group with liver disease. (F) The SFIs of the bands marked by red lines at approximately 25 kDa for three IAV strains and the H1N1 vaccine strains binding to the salivary protein samples from the group with liver disease. (G) Lane 1: MH; lane 2: FH; lane 3: male GC patients (MG); lane 4: female GC patients (FG). (H) The summed fluorescence intensities for SNA and MAL-II strains binding to the salivary protein samples from the group with GC. (I) The SFIs of the bands marked by red lines at approximately 25 kDa for three IAV strains and the H1N1 vaccine strains binding to the salivary protein samples from the group with GC.

