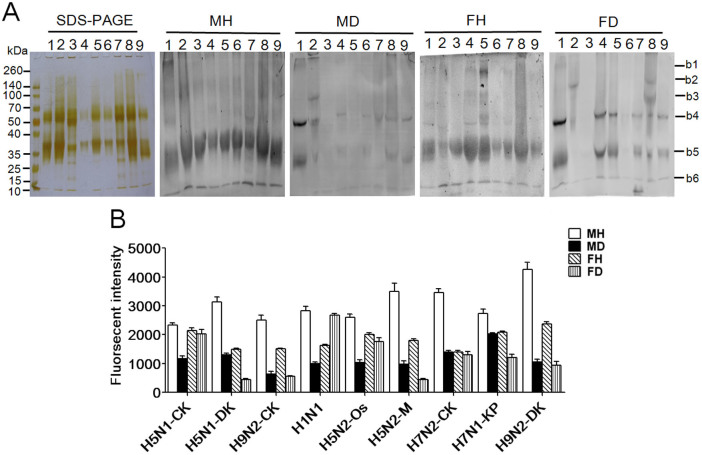
Figure 4. Comparison of the binding pattern profiles of eight IAV strains and the H1N1 influenza A vaccine against the binding patters of salivary groups with T2DM.
MH: male healthy group, MD: male T2DM patients, FH: female healthy group, FD: female T2DM patients; The summed fluorescence intensities of the blotting analyses for IVA; lane 1 to lane 9 were read by ImageQuant Tools. (A) Lane 1: A/Chicken/Guangxi/4/2009(H5N1); Lane 2: A/Duck/Guangdong/17/2008(H5N1); Lane 3: A/Chicken/Fujian/S-1-521/2008(H9N2); Lane 4: H1N1 influenza A vaccine; Lane 5: A/Ostrich/Denmark/96-72420/1996(H5N2); Lane 6: A/Mallard/Jiangxi/16/2005(H5N2); Lane 7: A/Chicken/Hebei/1/2002(H7N2); Lane 8: A/Fowl/Rostock/45/1934(H7N1); Lane 9: A/Duck/Guangdong/S-7-134/2004 (H9N2). (B) The summed fluorescence intensities for the salivary samples from the T2DM group that bound to 8 IAV strains and the H1N1 vaccine.

