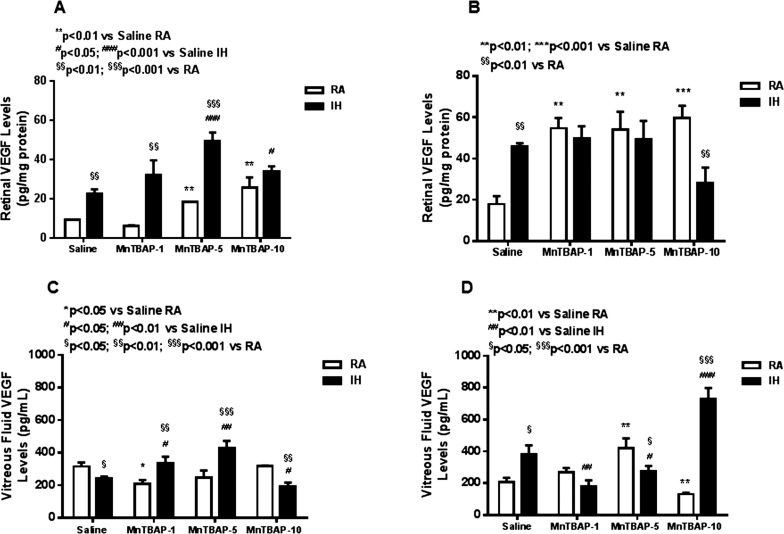
Figure 3.
Dose–response effects of MnTBAP on retinal VEGF in neonatal rats at P14 (A) and P21 (B) and vitreous fluid VEGF at P14 (C) and P21 (D). Treatment groups are as described for Figure 1. Statistical analyses were conducted as described for Figure 1. Data are presented as mean ± SEM (n = 6 samples/group).

