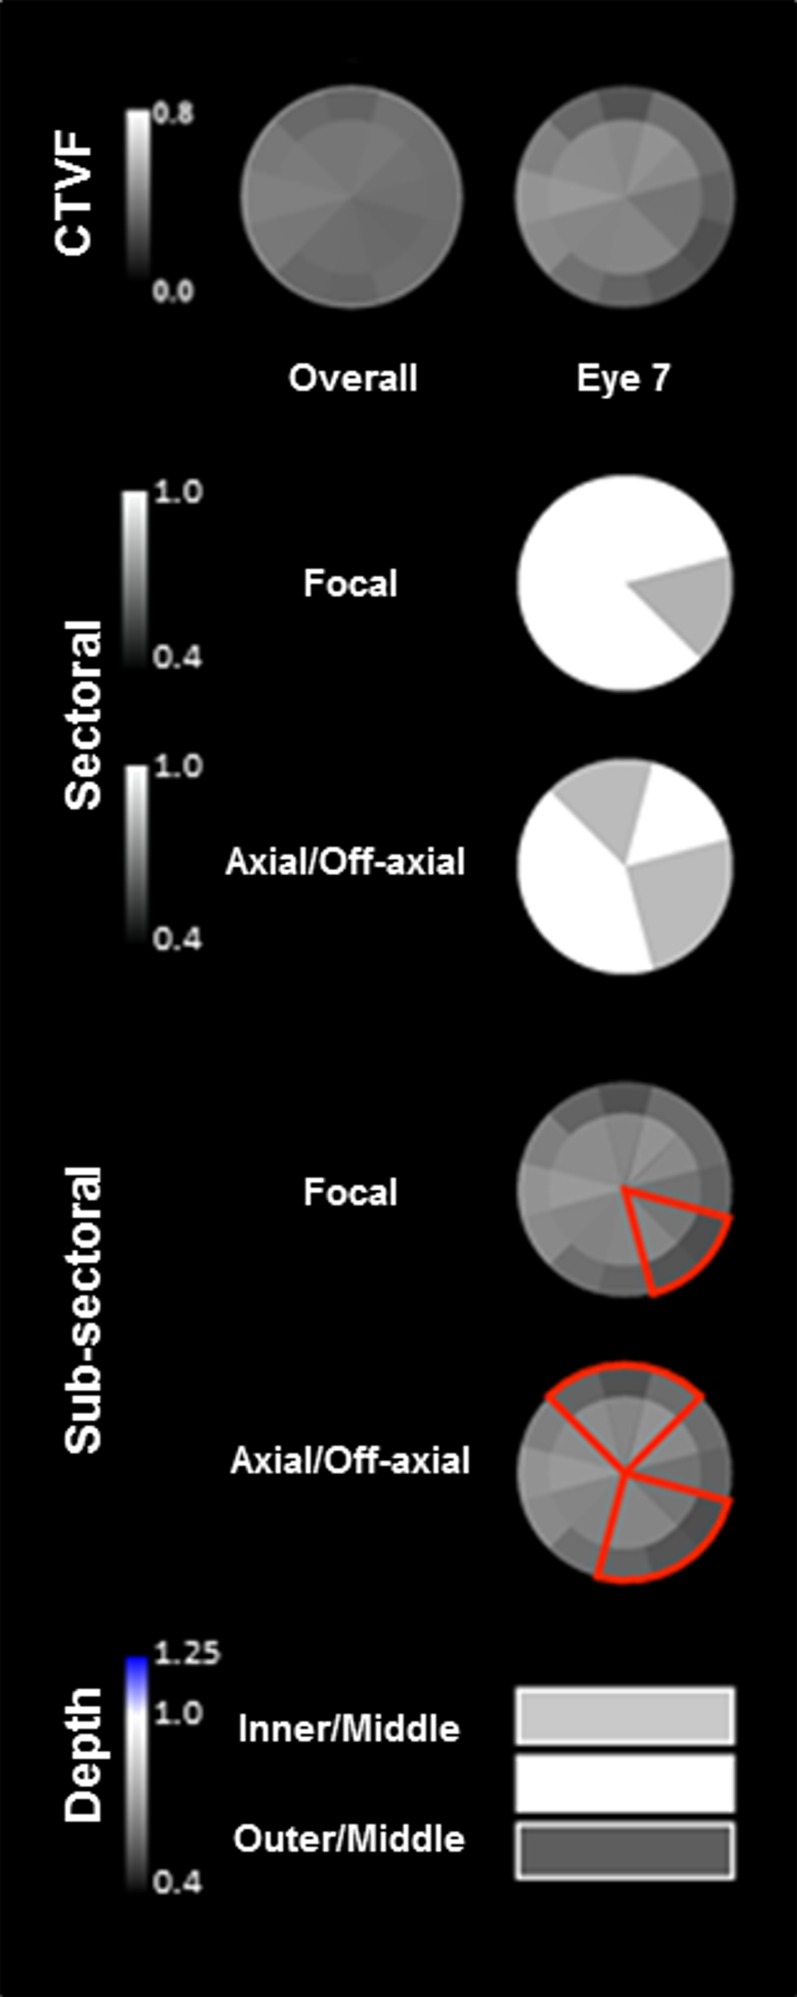
Figure 8.
Eye-specific LMA sectoral, subsectoral, and depth discordance mapping in a representative study eye. Overall (left) (all 21 eyes) and eye-specific (study eye 7, right) FoBMO subsectoral CTVF data are shown for study eye 7 in the top row. For CTVF, we define LMA discordance to be present in those sectors in which CTVF is lowest compared to all other sectors of the ONH. Focal (all combinations of two, three, or four adjacent sectors) and axial sectoral discordance (all possible combinations of four, five, or six sectors on either side of BMO centroid—two or three adjacent sectors on one side and two, three, or four adjacent sectors on the other side) are shown in rows 2 and 3. These plots identify the sectoral location and magnitude (grayscale, left) of the greatest discordance from all other sectors (depicted in white). The locations of focal and axial subsectoral discordance are depicted in red in rows 4 and 5. These plots identify those sectors in which the ratio of the peripheral versus central subsectoral CTVF is lowest compared to all other sectors. The magnitude of that ratio is not depicted. The magnitude of inner versus middle and outer versus middle CTVF depth discordance (scale to the left) is depicted in the bottom row. Note that while the superior-temporal (11 and 12) and inferior-temporal (6 and 7) sectors are qualitatively lowest in CTVF in the overall data for all 21 eyes, the nasal, inferior-nasal, and superior sectors are most commonly involved in sectoral and subsectoral discordance in study eye 7.

