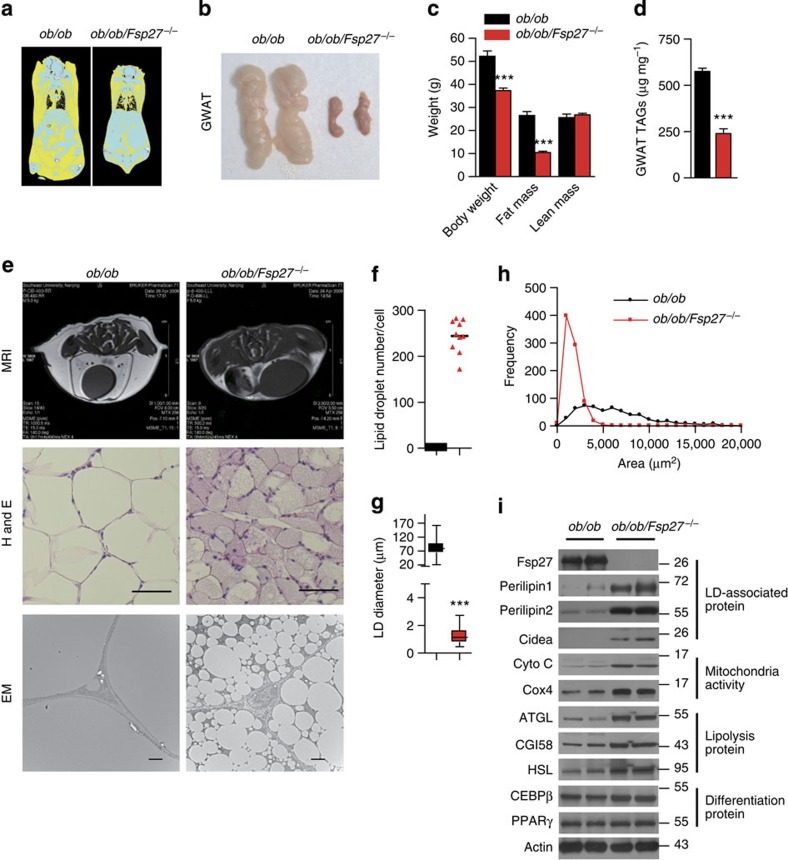
Figure 1. Reduced fat mass in the ob/ob/Fsp27−/− mice.
Four-month-old ob/ob and ob/ob/Fsp27−/− mice were maintained on a chow diet for the analyses shown in (a–i). (a) computed tomography (CT) scan analysis of the mice; fat is shown in yellow. (b) GWAT of ob/ob and ob/ob/Fsp27−/− mice. (c) Body composition of ob/ob (n=5) and ob/ob/Fsp27−/− mice (n=6). (d) Decreased TAG content in the GWAT of the ob/ob and ob/ob/Fsp27−/− mice (n=5). (e) Abdominal magnetic resonance imaging (MRI) of ob/ob and ob/ob/Fsp27−/− mice (upper panel). Fat is shown in white in these MRI images. GWAT morphology (middle and lower panels). H&E, haematoxylin and eosin staining; EM, electron microscope. Scale bar, 64 and 2 μm for H&E staining and EM, respectively. (f) LD number per adipocyte in ob/ob and ob/ob/Fsp27−/− mice. The number of LDs in ten adipocytes was measured. (g) The average LD diameter in the GWAT of ob/ob and ob/ob/Fsp27−/− mice. The diameter of LDs in ten adipocytes was measured. (h) The distribution of fat cell size in the GWAT of ob/ob and ob/ob/Fsp27−/− mice. The fat cell area from 400 adipocytes was measured. (i) A representative western blotting showing the expression pattern of Fsp27, Perilipin1, Perilipin2, Cidea, Cyto C, Cox4, ATGL, CGI58, HSL, CEBPβ and PPARγ in the GWAT of ob/ob and ob/ob/Fsp27−/− mice. Actin was used as a loading control. Quantitative data are presented as mean±s.e.m. Significance was established using a two-tailed Student’s t-test. Differences were considered significant at P<0.05. ***P<0.001.

