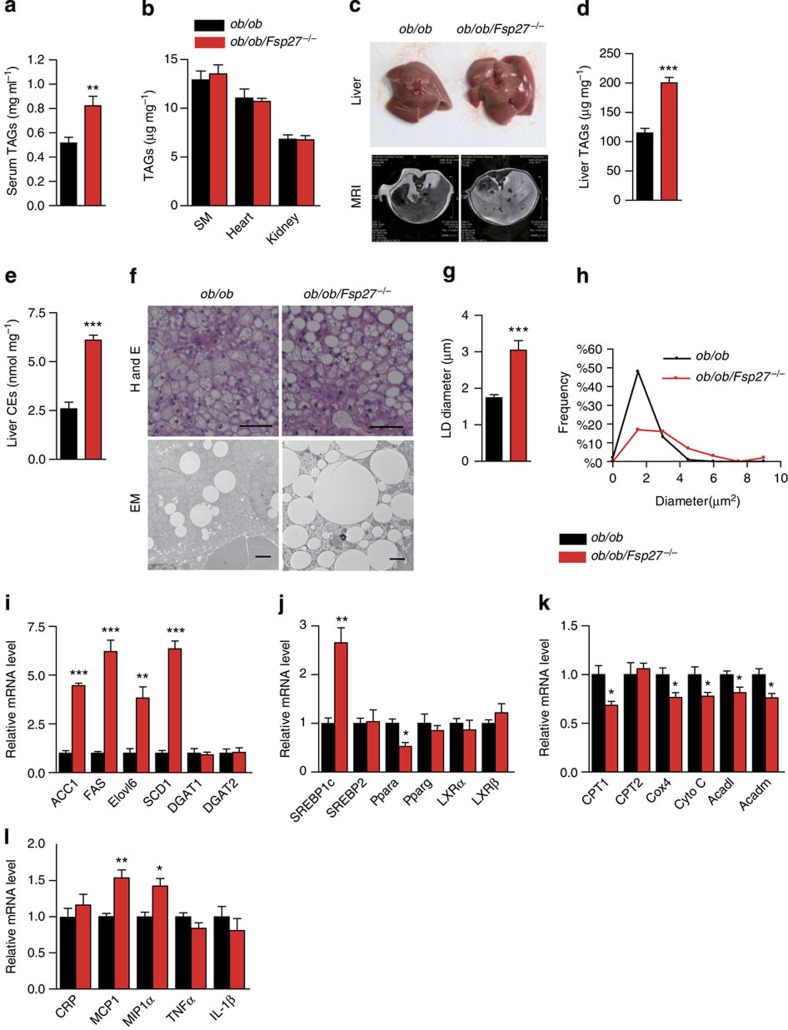
Figure 3. Hepatic steatosis in ob/ob/Fsp27−/− mice.
Four-month-old chow-fed ob/ob and ob/ob/Fsp27−/− mice were used (a–l). (a) Serum TAG concentrations (n=6 per group). (b) TAG content in the skeletal muscle (SM, gastrocnemius), heart and kidney (n=5 per group). (c) Photograph of the liver (top panel) and magnetic resonance imaging analysis of the liver section (lower panel). (d) Liver TAG content (n=8 for ob/ob and n=10 for ob/ob/Fsp27−/− mice). (e) Liver CE content (n=5 per group). (f) Liver histology of ob/ob and ob/ob/Fsp27−/− mice. H&E, haematoxylin and eosin staining. EM, electron microscope image. Scale bar, 64 and 2 μm for HE and EM, respectively. (g) The average LD diameter in the liver of ob/ob and ob/ob/Fsp27−/− mice. The diameter of LDs in 50 cells was measured. (h) The distribution of LD size in the liver of ob/ob and ob/ob/Fsp27−/− mice. (i–l) Relative mRNA expression levels in the livers of ob/ob and ob/ob/Fsp27−/− mice (n=4 per group). Quantitative data are presented as mean±s.e.m. Significance was established using a two-tailed Student’s t-test. Differences were considered significant at P<0.05.*P<0.05, **P<0.01, ***P<0.001.

