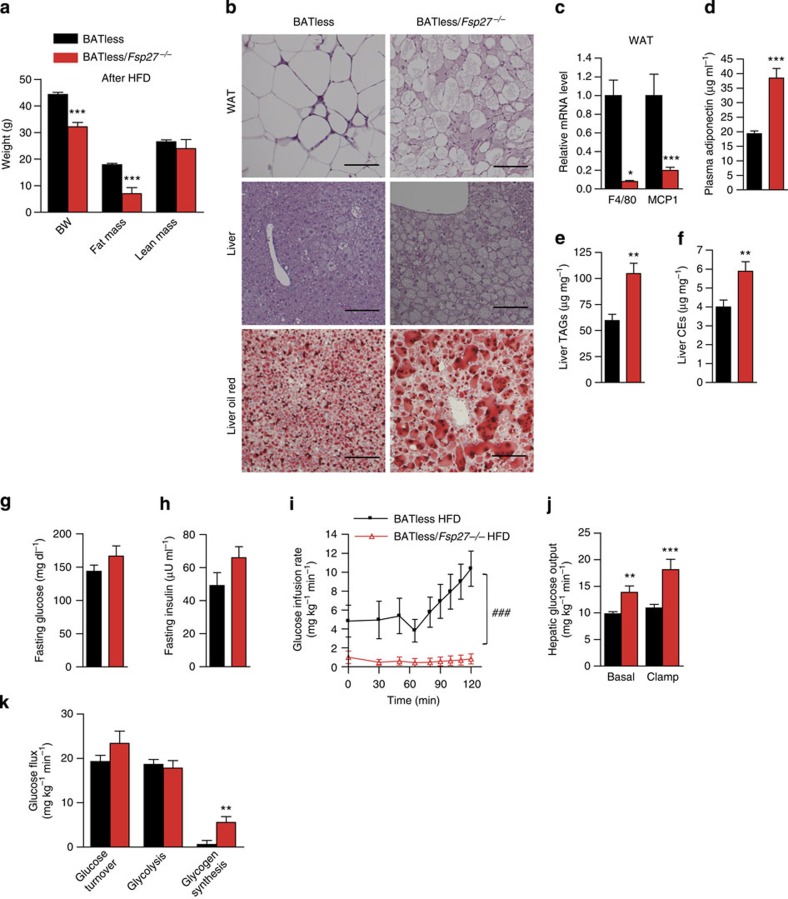
Figure 6. Reduced adipose inflammation but hepatic insulin resistance in BATless/Fsp27−/− mice.
Three-month-old BATless (n=12) and BATless/Fsp27−/− (n=8) mice were challenged with HFD (D12492, 60% kcal of fat) for 6 weeks. (a) Body composition after the HFD. (b) Morphology of WAT (upper panel) and the liver (middle panel); Oil-red staining (lower panel) of the liver in BATless and BATless/Fsp27−/−mice. Scale bar, 64 μm for H&E (haematoxylin and eosin staining). (c) Relative mRNA levels of macrophage markers F4/80 and MCP1 in WAT (BATless, n=11; BATless/Fsp27−/−, n=7). (d) Plasma concentration of adiponectin (BATless, n=11; BATless/Fsp27−/−, n=8). (e) Liver TAG content and (f) liver CE content (BATless, n=9; BATless/Fsp27−/−, n=7). (g) Fasting glucose and (h) fasting insulin concentration in BATless and BATless/Fsp27−/− mice. Peripheral and hepatic insulin sensitivity were assessed using hyperinsulinaemic–euglycaemic clamps (i–k). (i) Glucose infusion rates. (j) Hepatic glucose output during basal and hyperinsulinaemic clamp conditions. (k) Peripheral glucose turnover. Quantitative data are presented as mean±s.e.m. Significance was established using a two-tailed Student’s t-test. Differences were considered significant at P<0.05.*P<0.05, **P<0.01, ***P<0.001. Two-way repeated-measurement analyses of variance were used to evaluate the data in Fig. 6i (###P<0.001 in this figure indicates that the two groups respond differently following the intervention).

