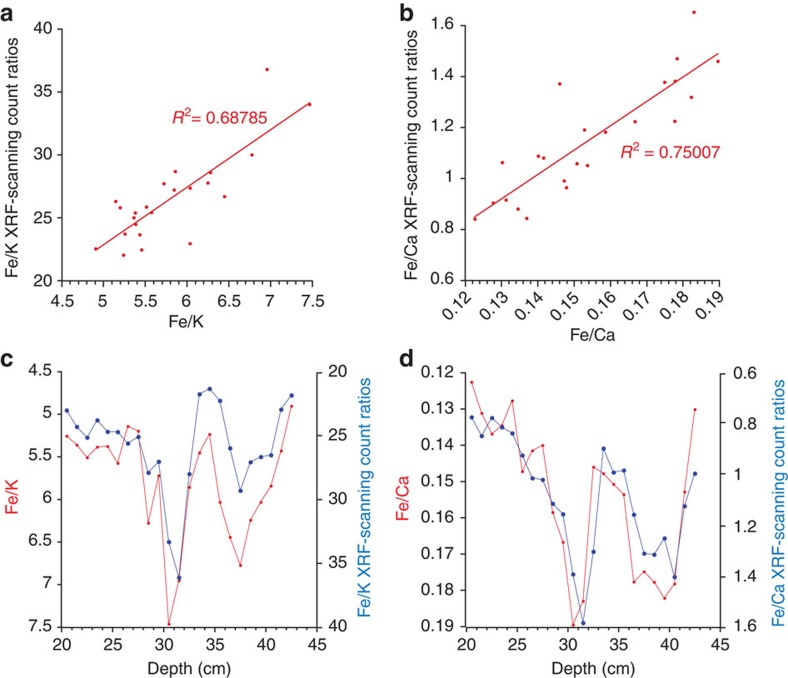
Figure 5. Calibration of the XRF scanning counts.
Calibration using a set of samples that was analysed for absolute bulk elemental concentrations using ICP-MS. (a) Fe/K XRF scanning counts versus absolute Fe/K ratios. (b) As in a but for Fe/Ca. (c) Fe/K scanning counts and absolute Fe/K versus depth over the calibrations interval. (d) As in c but for Fe/Ca.

