
Figure 4.
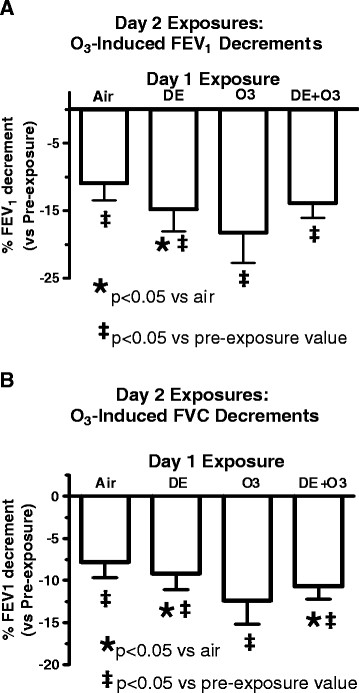
Changes in FEV1 (A) and FVC (B) immediately post Day 2 O3exposure (0. 300 ppm). *p < 0.05 vs air exposed values using Mixed Effects Model testing.
Official websites use .gov
A
.gov website belongs to an official
government organization in the United States.
Secure .gov websites use HTTPS
A lock (
) or https:// means you've safely
connected to the .gov website. Share sensitive
information only on official, secure websites.
Changes in FEV1 (A) and FVC (B) immediately post Day 2 O3exposure (0. 300 ppm). *p < 0.05 vs air exposed values using Mixed Effects Model testing.