Figure 5.

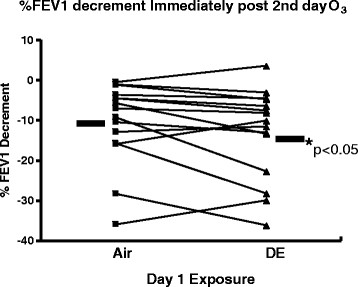
Individual changes (n = 15) in FEV1 immediately after Day 2 O3exposure for individuals exposed to either air or DE on day 1. *p < 0.05 vs air exposure using Mixed Effects Model testing.

Individual changes (n = 15) in FEV1 immediately after Day 2 O3exposure for individuals exposed to either air or DE on day 1. *p < 0.05 vs air exposure using Mixed Effects Model testing.