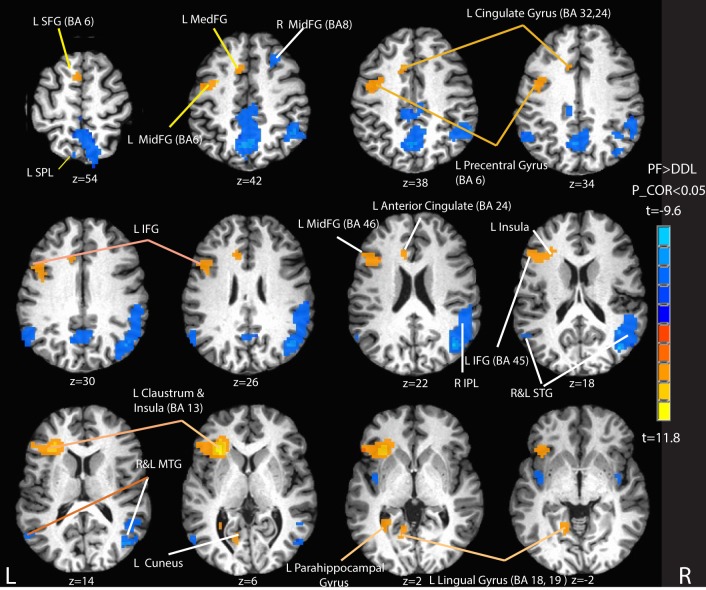
Figure 5.
Selected activation maps for written phonemic fluency (PF) vs. the control condition of drawing double loops (DDL). Orange and yellow areas represent Phonemic Fluency > Control activation. Blue areas represent Control > Phonemic Fluency activation. Peak activation foci are reported in Table 2. L SFG, left superior frontal gyrus; L SPL, left superior parietal lobule; L MedFG; left medial frontal gyrus; L MidFG, left middle frontal gyrus; R MidFG, right middle frontal gyrus; L IFG, left inferior frontal gyrus; R IPL, right inferior parietal lobule; R and L STG, right and left superior temporal gyrus; R and L MTG, right and left middle temporal gyrus. P_COR, false discovery rate corrected p-value.

