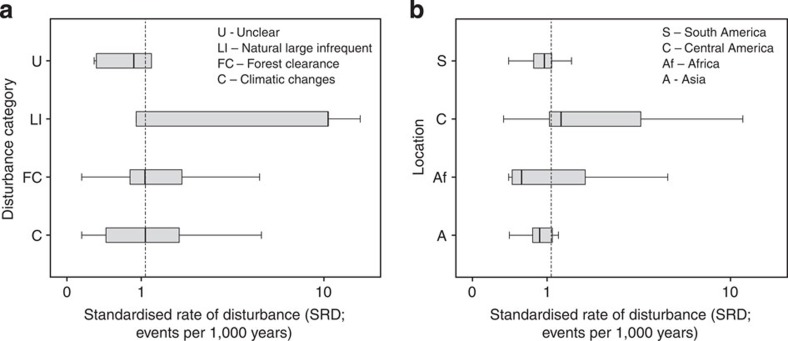
Figure 4. Composite figure showing the standardized rate of disturbance (SRD) of different disturbance categories and locations.
Box plots displaying the relationship between the SRD and (a) different grouped disturbance categories and (b) geographical location groups. (See Fig. 2 legend for details on notation and sample sizes). The SRD is plotted on a logarithmic scale to accommodate the variability in the data set. The vertical line in a and b represents the median SRD for the entire data set, that is, 1.072 disturbance events per 1,000 years. Shaded areas on a and b represent the interquartile range and the whisker lines the 95% confidence intervals for each category.

