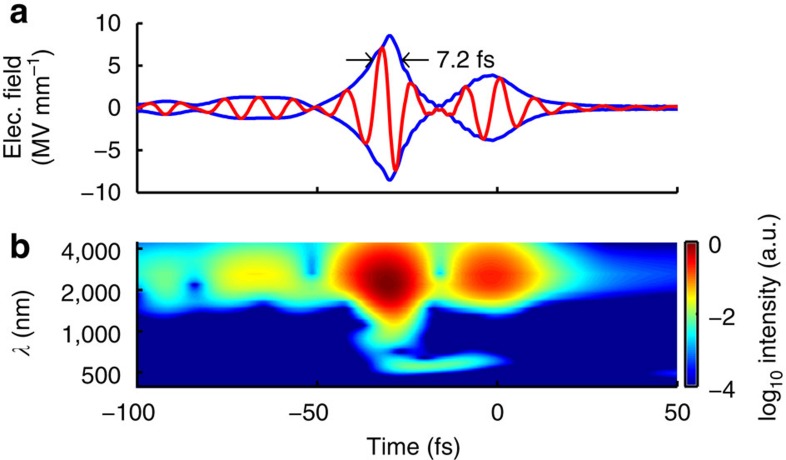
Figure 6. Self-compression structure.
(a) Temporal profile and spectrogram of output pulse. Temporal envelope (blue) and field oscillations (red) and (b) spectrogram of the on-axis simulated pulse emerging from the YAG plate; note the logarithmic intensity colour and wavelength scale in the spectrogram.

