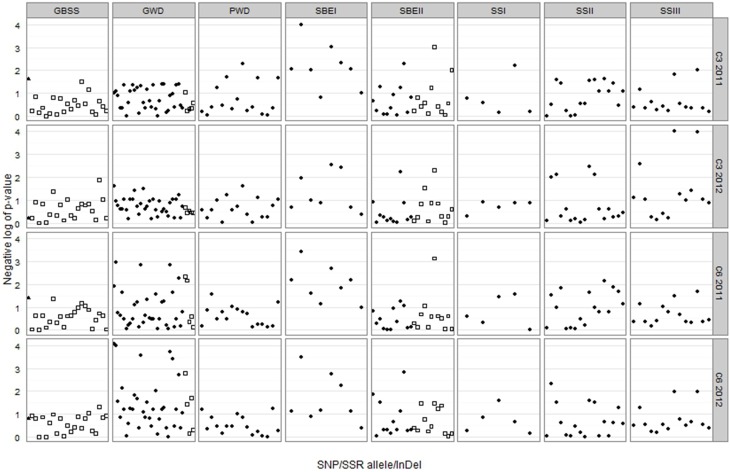
Figure 5.
Trellis plot of the negative log of p-value for each combination of genetic marker and trait-year. The GBSS InDel is represented by a triangle, SNPs are represented by circles and SSR alleles by squares. A negative log value of 3 corresponds to p = 0.001, and a negative log of 2 corresponds to p = 0.01.

