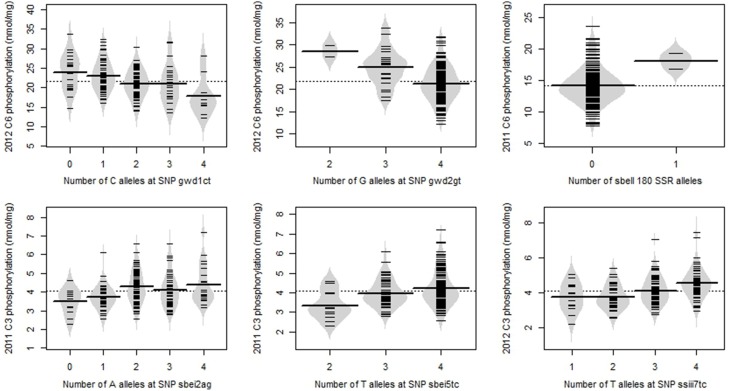
Figure 6.
Beanplots showing the relationship between allele copy number and degree of phosphorylation for representative examples of the most significant SNP/SSRs. The overall mean is shown as a dotted line; the mean value for each allele copy number is shown as a line across the middle of each bean, and results for individual potato lines are shown by the short lines within the beans.

