
Figure 1.
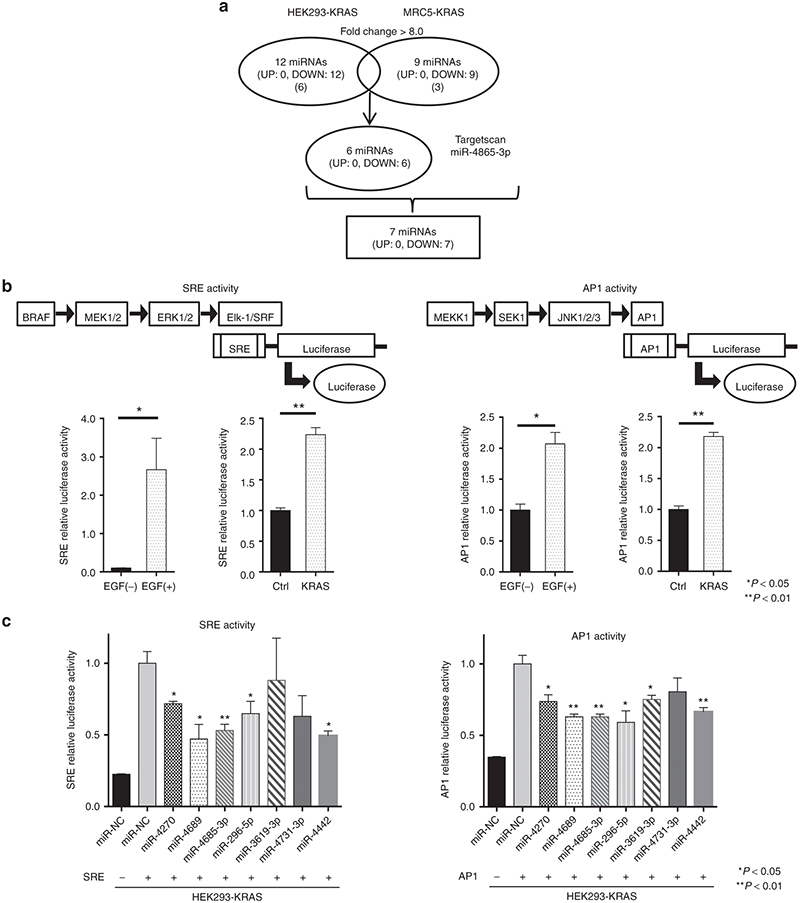
Screening for candidate miRs that could suppress SRE or AP1 transcription activity in HEK293-KRAS. Mutant KRAS cDNA was introduced into HEK293 or MRC5 cells. MiRNA expression profiles were compared between these cells with a miRNA microarray analysis (see Supplementary Figure S1). (a) Schematic diagram of the results of microarray analysis. The protocol identified 6 miRNAs common to both cell lines that showed >8.0-fold decreased expression in HEK293-KRAS and MRC5-KRAS compared to control HEK293 and MRC5 cells. In addition to those six miRNAs, we identified miR-4685-3p with a Target Scan search, which indicated that it was likely to bind to the 3′UTR region of MEK2, and it functioned downstream of the KRAS signaling pathway (see Supplementary Table S1 and S2). (b) Activated KRAS signaling through (left) RAF-MEK-ERK and (right) MEKK1-SEK1-JNK transduction pathways. Addition of EGF or introduction of a mutant KRAS gene into HEK293 enhanced (left) SRE and (right) AP1 transcription of the luciferase reporter gene. (c) Screening candidate miRs to identify those that inhibit the two signal transduction pathways. Several miRNAs significantly suppressed SRE or AP1 transcription of luciferase compared with miR-NC in HEK293-KRAS cells. We selected miR-4689, miR4685-3p, miR-296-5p, and miR-4442 for further evaluations in mutant KRAS CRC cells. All data represent the mean ± SEM; * P < 0.05, ** P < 0.01.