
Figure 6.
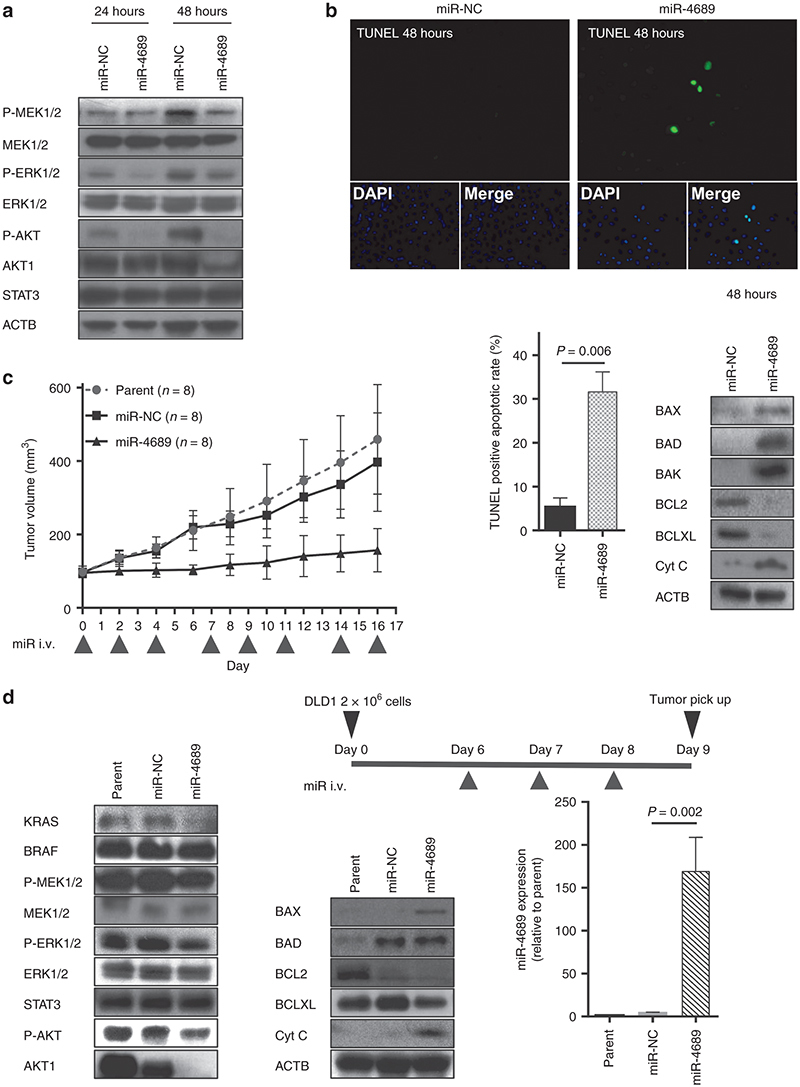
miR-4689 affects both RAF/MEK/ERK and PI3K/AKT pathways and induces apoptosis in mutant KRAS CRC cells. (a) Immunoblots show BRAF, P-MEK1/2, MEK1/2, P-ERK, ERK, P-AKT, AKT1, and STAT3 expression in KRASG13D DLD1 cells treated with miR-NC or miR-4689. ACTB is a loading control. Lipofectamine-mixed culture medium was exchanged with a fresh medium containing 10% FBS at 24 hours after transfection. (b) Apoptosis induced with miR-4689. (Top and Lower left) TUNEL staining (green) shows increased numbers of apoptotic KRASG13D DLD1 cells treated with miR-4689 compared to those treated with miR-NC. (Lower right) Immunoblots in whole cells show BAX, BAD, BAK, BCL2, BCLXL, and Cyt C expression in KRASG13D DLD1 cells treated with miR-NC (50 nM) or miR-4689 (50 nM). ACTB is a loading control. (c) Systemic delivery of formulated miR-4689 in vivo inhibited growth of established CRC tumors. Nude mice models with xenografted KRASG13D DLD1 tumors, received systemic administrations of carbonate apatite-formulated miR-4689 or miR-NC on days 0, 2, 4, 7, 9, 11, 14, and 16 via a tail vein injection (i.v., indicated below the X-axis). Each shot contained 40 µg of formulated oligo, with a 40% conjugation rate. Tumor volumes were assessed for the parent (no treated) (n = 8), miR-NC treated (n = 8), and miR-4689 treated (n = 8) groups on days 0, 2, 4, 6, 8, 10, 12, 14, and 16. All data represent the mean ± SEM (P < 0.0001, two-way ANOVA). (d) Characteristics of tumors induced in vivo by injection of KRASG13D DLD1cells. (Top) Diagram showing treatment protocol. (Day 0) Nude mice received bilateral, subcutaneous injections of KRASG13D DLD1cells (2 × 10⁶ cells) into the lower back region. Then, mice were injected via the tail vein with carbonate apatite-formulated miR-4689 or miR-NC on days 6, 7, and 8 after the cell injection. Tumors were resected on day 9. (Lower left and middle) Immunoblots show KRAS, BRAF, P-MEK1/2, MEK1/2, P-ERK1/2, ERK1/2, STAT3, P-AKT, AKT1, BAX, BAD, BCL2, BCLXL, and Cyt C expression in whole tumors excised from parent (no treated), miR-NC treated, and miR-4689 treated mice. (Lower right) Expression of miR-4689 in tumors treated with miR-4689 was significantly higher than that of tumors treated with miR-NC (P = 0.002). Data represent the mean ± SEM; n = 3 for each group.