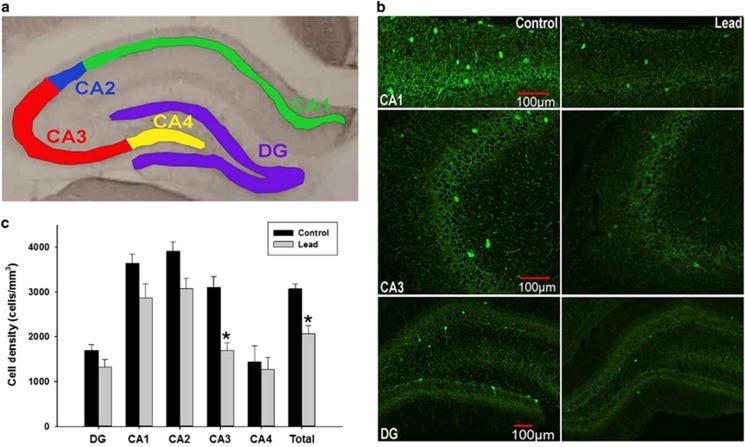
Figure 3.
Parvalbumin-positive cell density in control and Pb2+-treated rats in the hippocampus. (a) Representative areas used for PVGI cell counting in the pyramidal CA1 (green), CA2 (blue), CA3 (red), CA4 (yellow) subregions and granule cell layer of the dentate gyrus (DG; purple). (b) Confocal imaging of immunofluorescence labeled PVGI in the CA1, CA3 and dentate gyrus. (c) PVGI cell density in the pyramidal and granule cell layers of the dorsal hippocampus. Bar designated total was the average of all hippocampal subregions. Data are represented as the mean±s.e.m. *, significantly different from control.

