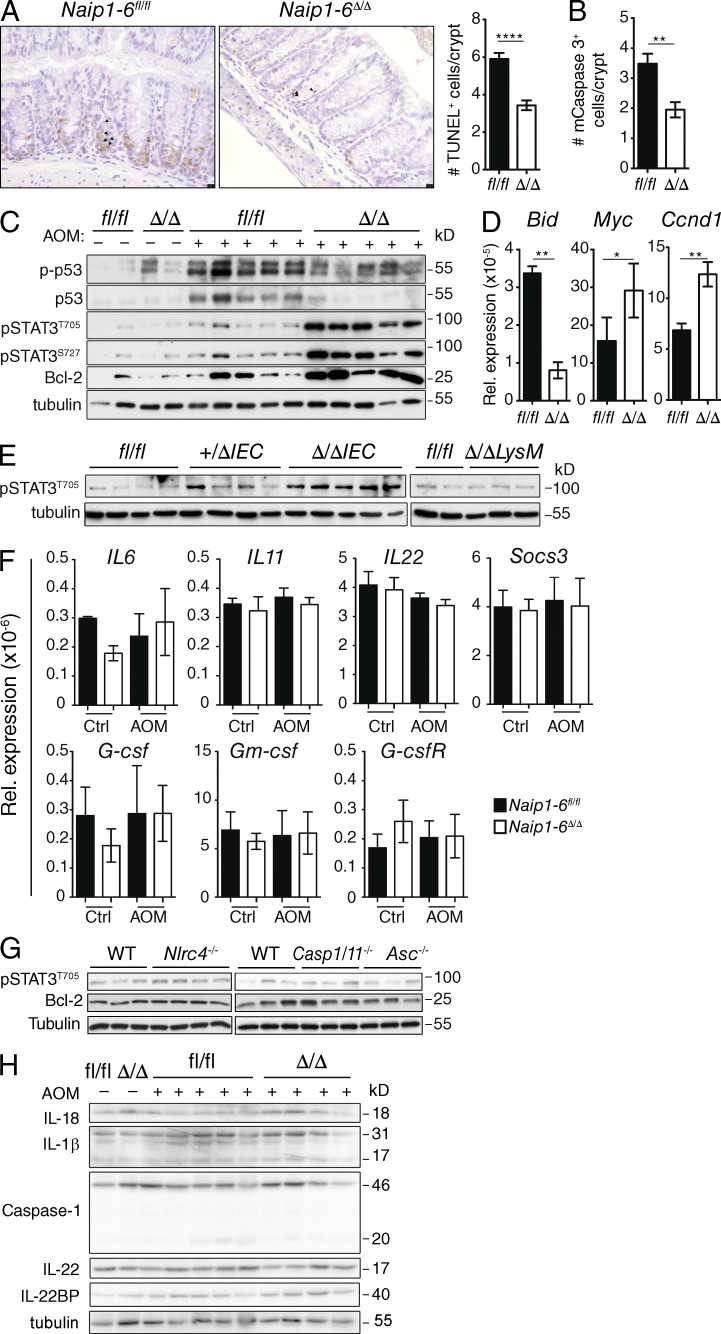
Figure 7.
The early response to AOM is altered in Naip1-6Δ/Δ mice. Naip1-6fl/fl and Naip1-6Δ/Δ mice were injected with AOM (10 mg/kg) and colons were analyzed 18 h later. (A) Representative sections of TUNEL staining on colon sections and quantification. 10 crypts in 5 independent fields of view per mouse were counted. Data are expressed as number of TUNEL+ cells per crypt. (B) Quantification of active caspase-3+ cells in colon sections, performed as in A. (C) Western blot analysis of the indicated proteins in lysates prepared from whole-colon homogenates. (D) Relative expression of indicated mRNA from whole colon homogenates (normalized to 18S rRNA). Five mice per group, representative of three independent experiments (A–D and F). Data shown as mean ± SEM. (E) Levels of pSTAT3 in colon homogenates of Naip1-6Δ/ΔIEC, Naip1-6Δ/ΔLysM, or Naip1-6fl/fl littermates after 18 h AOM exposure. Representative of two independent experiments. (F) Relative expression of indicated STAT-3–inducing mRNA targets from Naip1-6fl/fl and Naip1-6Δ/Δ whole colon samples as described for D. Data shown as mean ± SEM. (G) Nlrc4−/−, Caspase-1/11−/−, and Asc−/− mice were injected with AOM (10 mg/kg) and colons were analyzed 18 h later. Expression of pSTAT3 and Bcl-2 in colon homogenates was determined by Western blot (representative of two independent experiments). (H) Western blot analysis of Caspase-1, IL-18, IL-1β, IL-22, and IL-22BP in whole-colon homogenates from AOM and control-treated Naip1-6fl/fl and Naip1-6Δ/Δ mice (representative of two independent experiments). *, P < 0.05; **, P ≤ 0.01; ****, P < 0.0001.

