Figure 7.
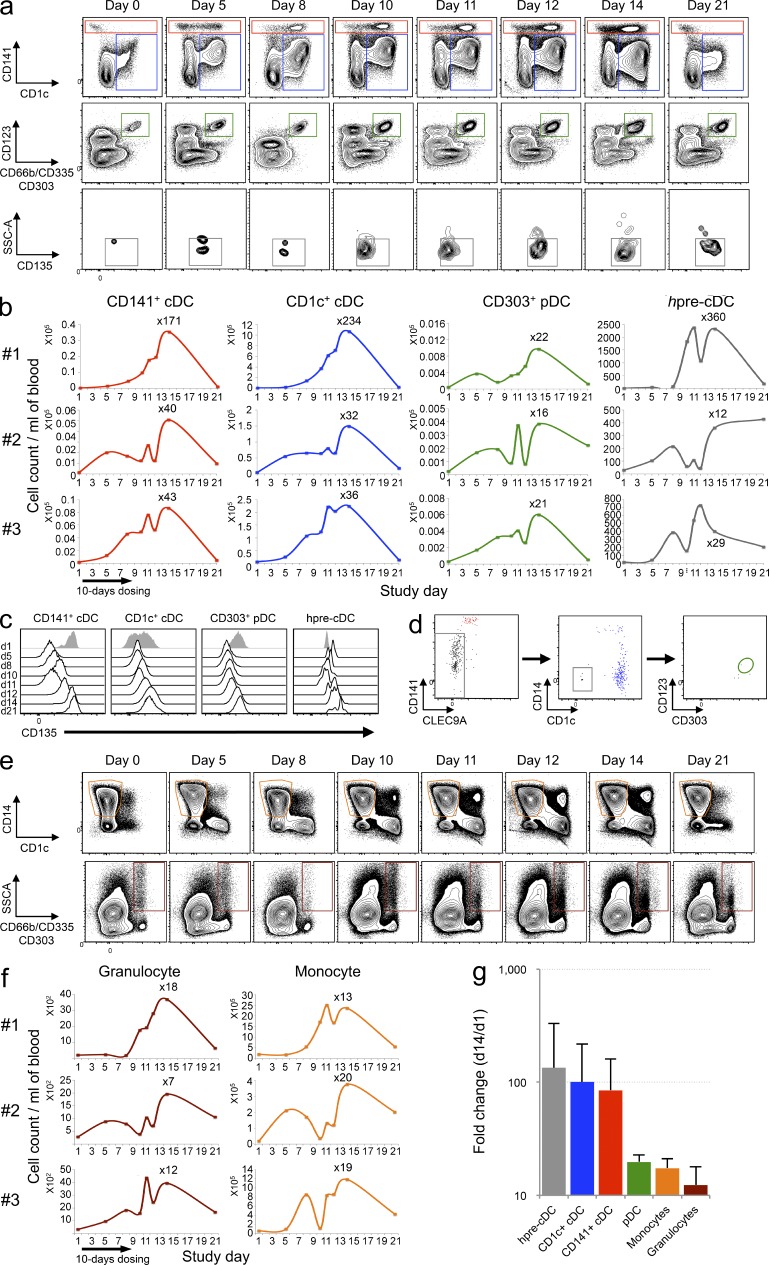
Flt3L administration increases circulating DC subsets and hpre-CDCs in humans. PBMCs from Flt3L-treated volunteers (n = 3; 25 µg/kg for 10 consecutive days) were analyzed by flow cytometry over a 21-d period to assess the expansion of DC subsets (CD1c+ cDCs [blue], CD141+ cDCs [red], and pDCs [green]; hpre-CDCs (gray); monocytes (orange); and granulocytes (brown). (a) Representative flow cytometry dot plots show DC subsets and hpre-CDCs in blood (gating strategy in Fig. S4). (b) Graphs show the kinetics of cell number of cDC subsets, pDCs, and hpre-CDCs over 21 d in 3 Flt3L-treated volunteers. The absolute numbers per milliliter of blood were obtained by multiplying the number of cells (obtained by flow cytometry) by the total number of PBMCs per milliliter of blood. (c) Representative histograms show CD135 expression on CD141+ cDCs, CD1c+ cDCs, pDCs and hpre-CDCs over 21 d in one Flt3L-treated volunteer. (d) Differentiation potential of purified hpre-CDCs from blood of Flt3L-injected volunteers in MS5+FSG cultures after 7 d. Flow cytometry plots of gated CD45+ cells from culture show output of CD141+ cDCs (red), CD1c+ cDCs (blue), and lack of pDCs (green gate). (e) Representative flow cytometry dot plots show CD14+ monocytes and CD66b+ granulocytes in blood (gating strategy in Fig. S4). (f) Graphs show the kinetics of cell number of monocytes and granulocytes over 21 d in 3 Flt3L-treated volunteers. The absolute numbers per milliliter of blood were obtained by multiplying the number of cells (obtained by flow cytometry) by the total number of PBMCs per milliliter of blood. (g) Graph showing the mean fold change increase from the three patients (d1 vs. d14) of hpre-CDCs (gray), CD1c+ cDCs (blue), CD141+ cDCs (red), pDCs (green), monocytes (orange), and granulocytes (brown) per milliliter of blood. Error bars are SDs.

