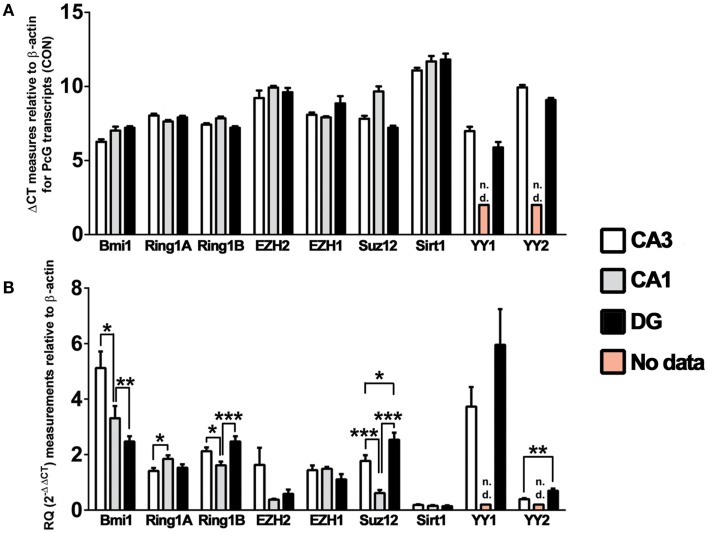
Figure 2.
Polycomb group transcripts expression in the mouse hippocampus. Graphs show qRT-PCR data and both the ΔCT and RQ for various core PcG transcripts, relative to β-actin. Measurements of basal PcG transcription, expressed as (A) the ΔCT value and (B) a derived RQ value (2−ΔΔCT versus the mean ΔCT value for all transcripts and subfields) were made using hippocampus from mice that received intra-amygdala PBS injection (n = 16), with analysis performed on microdissected hippocampal fractions enriched for CA3, CA1, and DG. Derived RQ values in (B) were statistically appraised by one-way analysis of variance to determine differences between subfields in basal transcription of each PcG subunit. Data expressed as mean ± SEM. *P < 0.05, **P < 0.01, ***P < 0.001 for n = 16. CA, cornu ammonis; CON, control; DG, dentate gyrus; n.d., no data.

