
Figure 1.
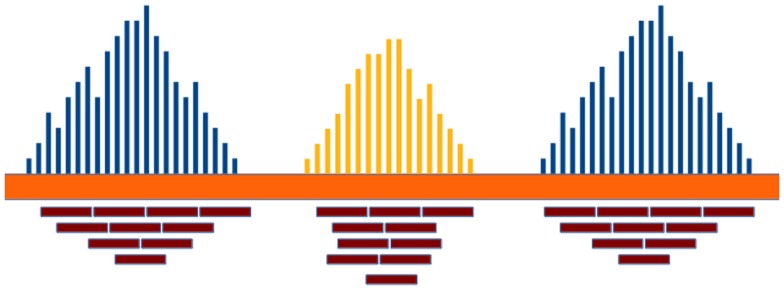
The RD in a genomic region depends on the copy number of that region and follows a Poisson distribution. Duplicated and deleted regions are characterized by a RD signal different from that of the other ones.
Official websites use .gov
A
.gov website belongs to an official
government organization in the United States.
Secure .gov websites use HTTPS
A lock (
) or https:// means you've safely
connected to the .gov website. Share sensitive
information only on official, secure websites.
The RD in a genomic region depends on the copy number of that region and follows a Poisson distribution. Duplicated and deleted regions are characterized by a RD signal different from that of the other ones.