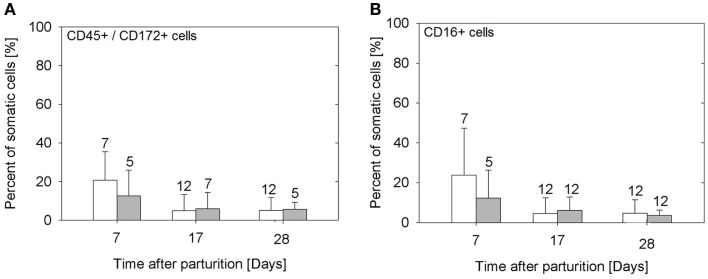
Figure 2.
Percentage of myeloid (CD45+/CD172a+) cells (A), and of cells expressing the FcγR III (B) in the milk of sows in the control group (open bars) and in the probiotic group (filled bars). Bars illustrate arithmetic means with respective SD. The number of samples analyzed per group is indicated with the numeral upon the error bar. Values of CD45+/CD172a+ cells decrease from day 7 to later time points (P = 0.0019), as do the percentages of cells expressing FcγR III (P = 0.001).

