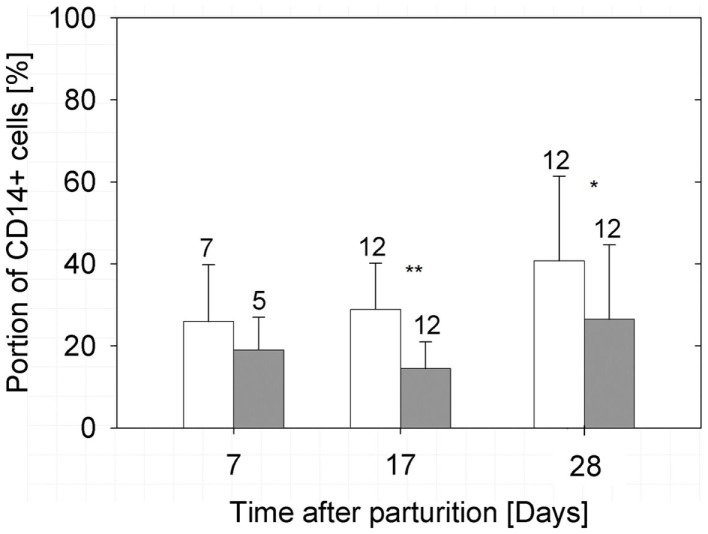
Figure 3.
Percentages of CD14-positive cells in the milk of treated (filled bars) and non-treated (open bars) sows. The bars illustrate arithmetic means with respective SD. The number of samples analyzed per group is indicated by the numeral at the error bar. A strong significant difference (P < 0.01) and a highly significant difference (P < 0.001) between the groups are indicated by one or two asterisks, respectively.

