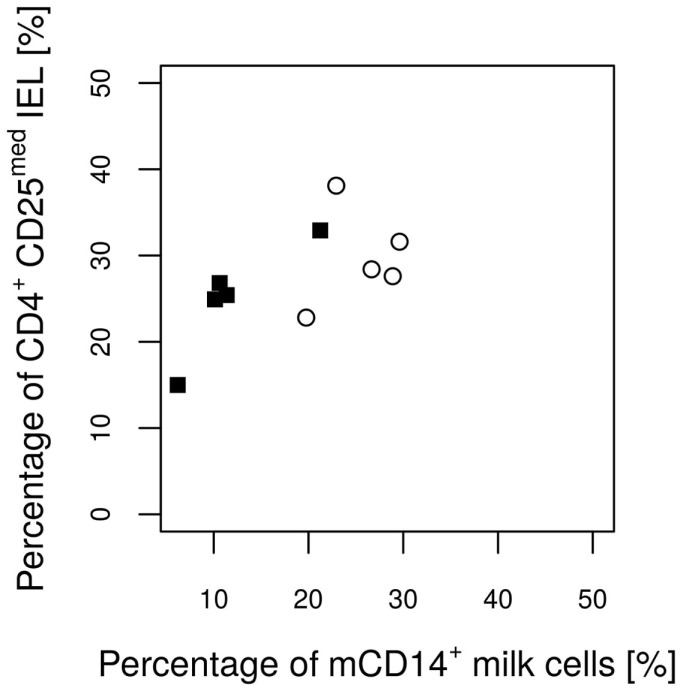
Figure 6.
Percentages of CD4+ CD25med T cells from total lymphocytes in the IL MLN of the piglets on day 12 in relation to the CD14 value of the attendant sow milk measured on day 17 of lactation. Values of the control group and the E. faecium group are pictured with filled squares or blank circles, respectively. The Pearson correlation coefficient (ρ = 0.64) indicates a significant (P = 0.047) linear positive dependence.

