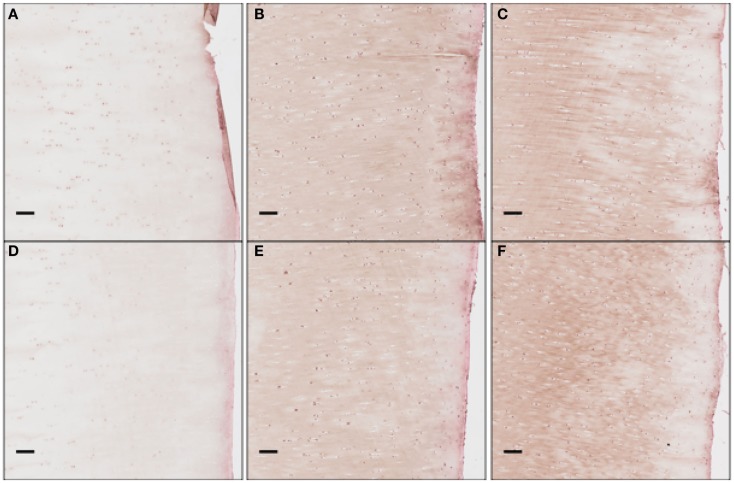
Figure 12.
The concentration of EPO as a function of “positive cells.” Each scale bar is 100 μ. Immunohistochemistry images were analyzed for “positive cells,” indicating that they were above the background thresholding technique and within our cell size criteria. (A) shows concentration at day 1 at the impact site, (B) at day 7 at the impact site, (C) at day 14 at the impact site, (D) at day 1 a distance 2 mm from the impact site, (E) at day 7 at 2 mm away, and (F) at day 14 at 2 mm away. We see clearly EPO being less constitutively expressed at day 1, when compared to day 7 or 14.

