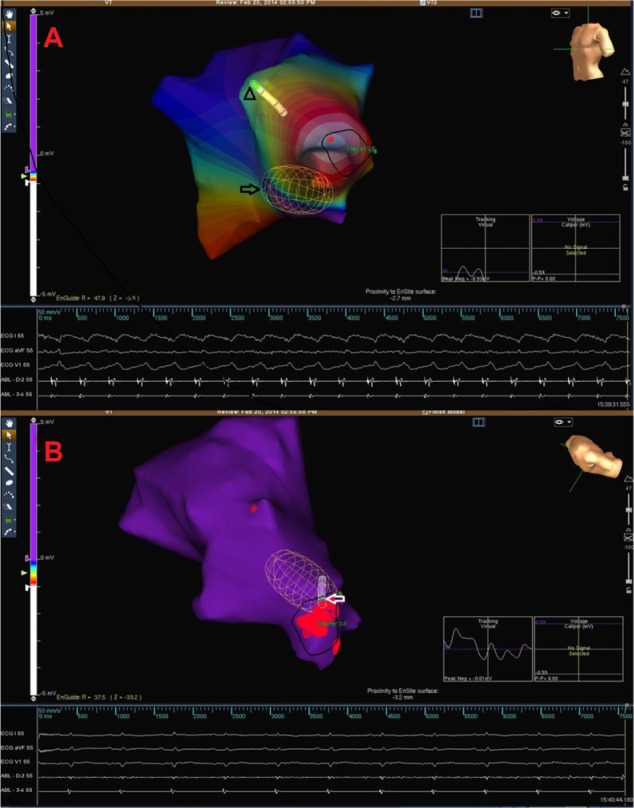
Figure 4.

Electrocardiograms and endocardial activation maps.
Notes: Electrocardiograms and endocardial activation map of ventricular tachycardia. Arrow indicates the Ensite Array catheter. The ablation catheter (arrowhead) is seen as shaded (A). Electrocardiograms and endocardial activation map after successful ablation. The ablation catheter (arrow) is in the region of sinus rhythm is achieved (B).
