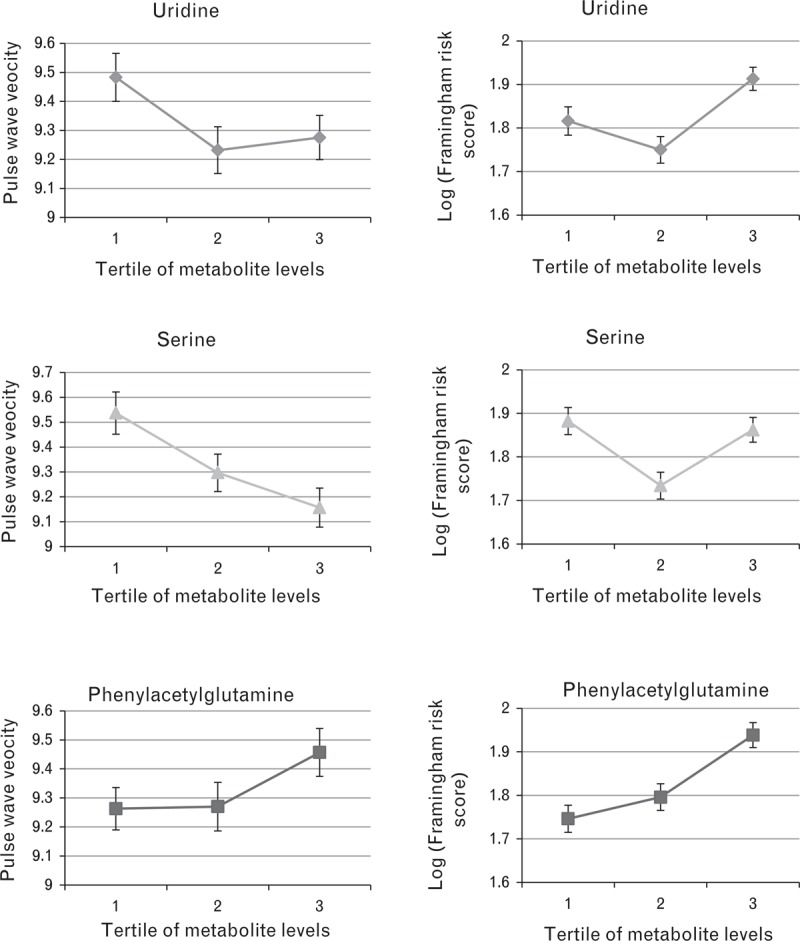
FIGURE 1.

Metabolite associations with PWV and cardiovascular risk as measured by the Framingham risk scores. Mean PWV and log Framingham risk scores (adjusted for age, BMI and batch) are shown by tertiles of selected metabolites. PWV, pulse-wave velocity.
