
Fig. 9.
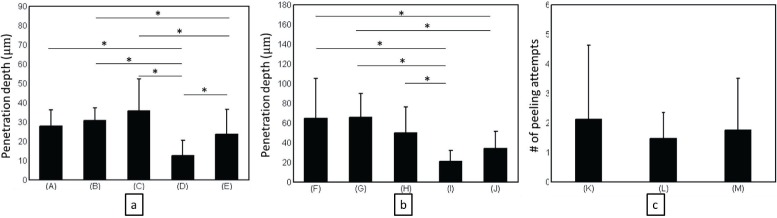
Averages and standard deviations of the data with significantly different groups marked with * (p < 0.05). The x-axis labels the experimental condition as described in Table 1. The y-axis indicates the means and standard deviations of the measurements. (a) The approaching task to the gelatin phantom model (A to E); (b) The approaching task to the ex vivo goat retina (F to J); (c) The membrane peeling task on the gelatin phantom model (K to M).