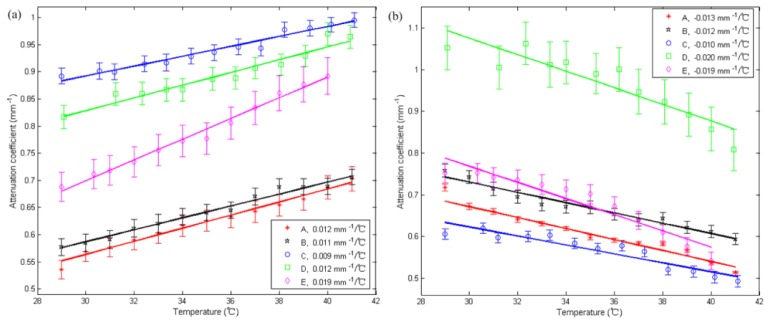
Fig. 8.

Average obtained by averaging of all positive correlation regions (a) and all negative correlation regions (b) in dermis of in vivo human skin versus temperature from 29 to 41°C for the five subjects. The solid lines are calculated by using least-squares fit for the experimental data of the subjects under test. Each of the fitted slopes was labeled in the legend as the temperature coefficient.
