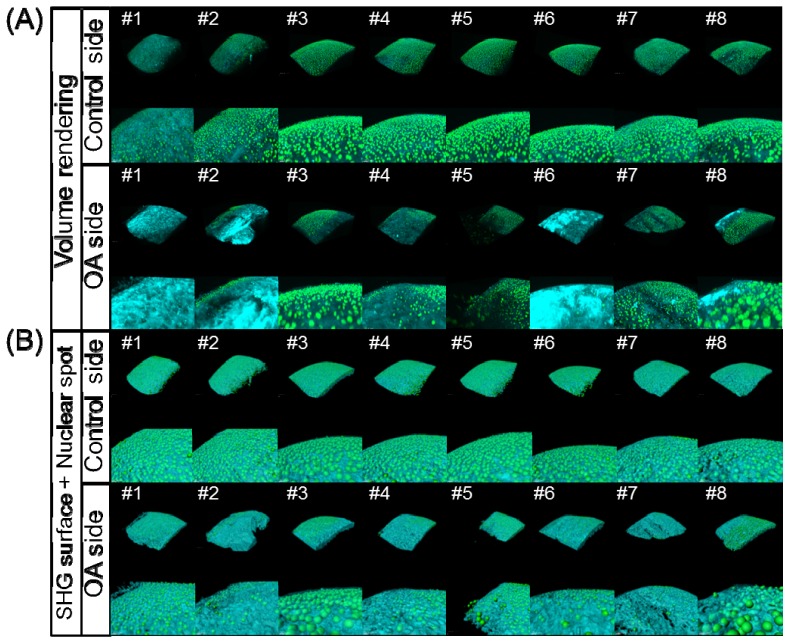
Fig. 2.
Results of the 3D image processing of the acquired SHG/TPEF images in the medial condyle of the femur in the OA model mice. (A) Volume rendering images on the control side (upper two columns, overall view and magnified view) and OA side (lower two columns, overall view and magnified view). (B) Merged images of the SHG surface and nuclear spot images on the control side (upper two columns, overall view and magnified view) and OA side (lower two columns, overall view and magnified view).

