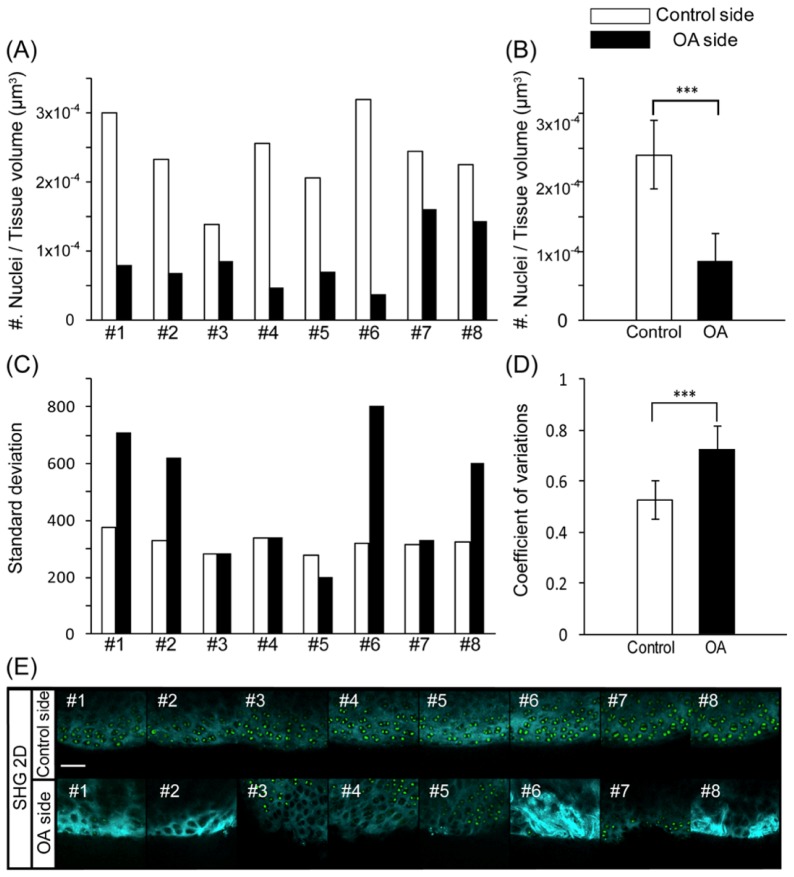
Fig. 3.
(A) Number of chondrocyte nuclei per tissue volume for each sample in the control and OA groups. (B) Average number of chondrocyte nuclei per tissue volume in the control and OA groups. ***p<0.001 according to Student’s t-test. (C) Standard deviation (SD) of the SHG signal intensity for each sample in the control and OA groups. (D) Average coefficient of variation (CV) for the SHG signal intensity. ***p<0.001 according to Student’s t-test. (E) Snapshot 2D SHG/TPEF images of the medial condyle of the femur on the control side (upper panel) and OA side (lower panel), scale bar: 50 μm.

