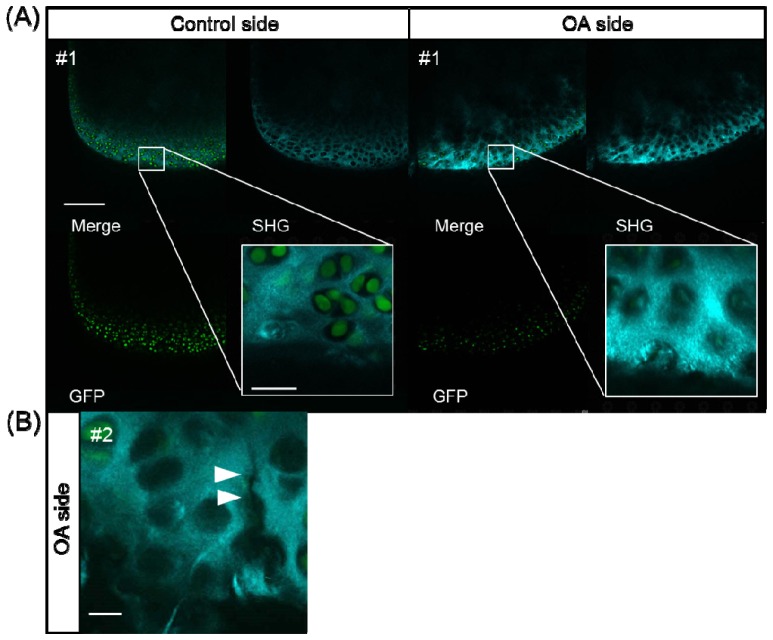
Fig. 4.
SHG/TPEF images of the medial condyle of the femur in the control and OA groups. (A) SHG image (upper right), TPEF of GFP image (lower left), merged image (upper left) and magnified image (white box). On the OA side, a fibrous pattern and empty lacunae were observed, scale bar: 25 μm. (B) Micro-cracks in the ECM (white arrows), scale bar: 10 μm.

