Fig. 10.
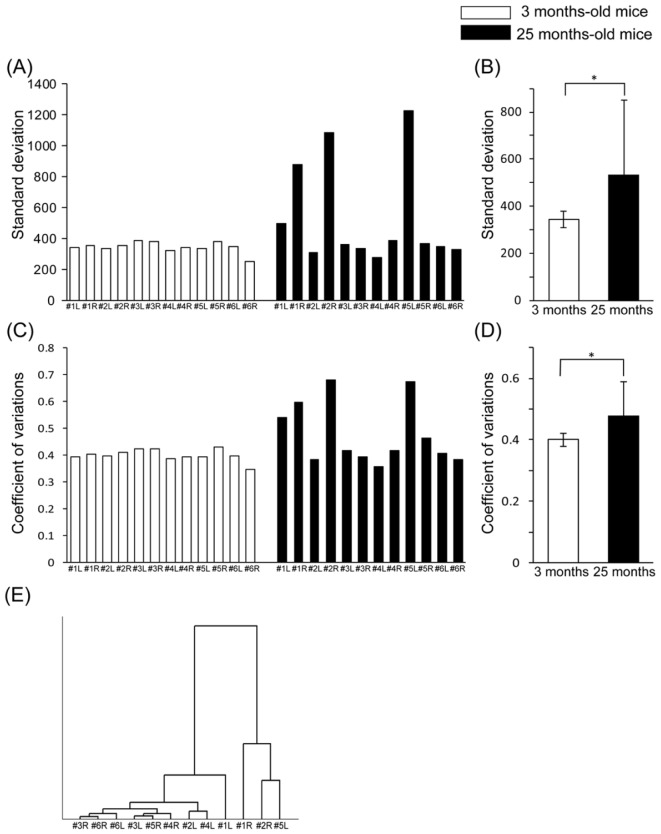
(A) Standard deviation (SD) of the SHG signal intensity for each sample in the young (3 months of age) and elderly mice (25 months of age). (B) Average SD of the SHG signal intensity. *p<0.05 according to Student’s t-test. (C) Coefficient of variation (CV) for the SHG signal intensity in each sample in the young and elderly mice. (D) Average CV for the SHG signal intensity. *p<0.05 according to Student’s t-test. (E) Hierarchical cluster analysis (HCA) of the SD in the elderly mice.

