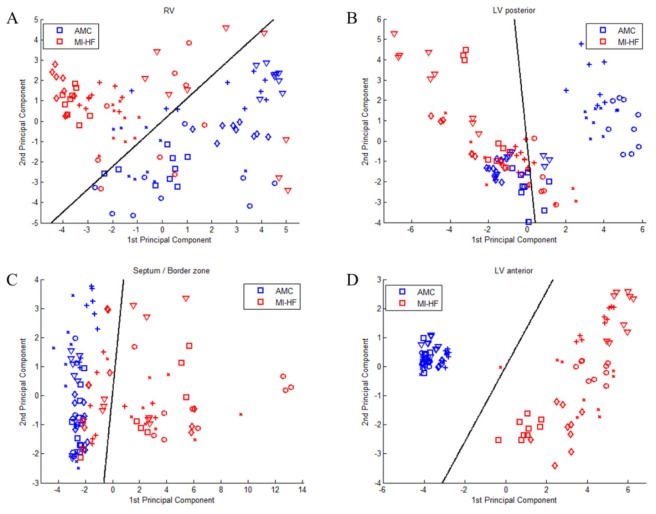
Fig. 9.
Results from PCA of all spectroscopic parameters for each ROI shown as scatter plots of the scores of the first two PC for each ROI: a) RV, b) LV posterior, c) border zone and d) LV anterior. Different markers in the scatter plot identify data obtained from different specimens. Black lines show the decision lines produced by LDA analysis.

