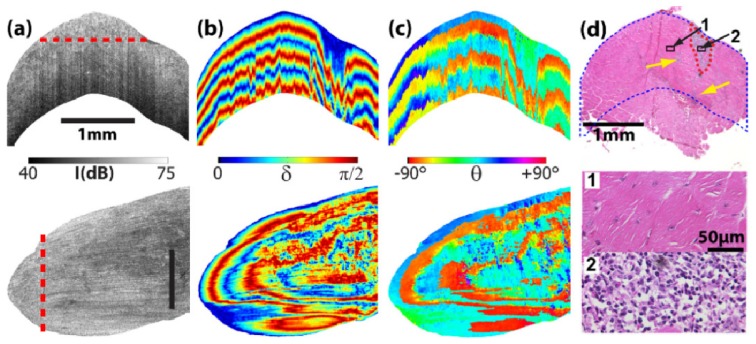
Fig. 1.

Representative images of (a) OCT intensity, conventional cumulative (b) retardance and (c) optical axis of the mdx 4cv TA muscle. The upper row shows cross-sectional images and the lower row shows the en face images with the corresponding extraction locations marked with the red dashed lines. The size bars in (a) indicate 1 mm. (d) The corresponding histology image (2 × ) where the blue dots mark the OCT imaging region. The red dashed lines circles the main necrotic region. Yellow arrows indicate additional small necrotic regions observed in the HE histology image. Also shown are high resolution histology images (40 × ) of the two small region-of-interest as marked in the 2 × histology image.
