
Fig. 3.
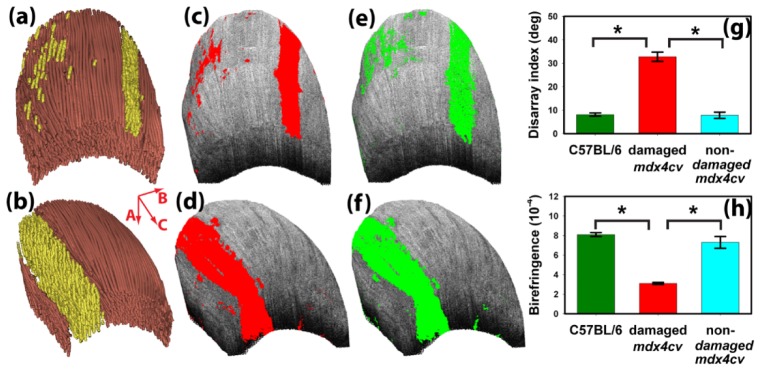
(a, b) The 3D OPT images of two TA muscles from two different mdx4cv mice. The mouse used in (a), (c), and (e) was the same as shown in Figs. 1 and 2. The corresponding segmented results of muscle damage using fiber disarray index with a 16° threshold are shown in (b) and (d). (e) and (f) show the segmentation results using a birefringence threshold of 3.8 × 10⁻⁴. Also shown are the statistical comparisons (*, p<0.0001) of the average (g) fiber disarray index and (h) local birefringence obtained in four mdx4cv mice and four C57BL/6 mice. Error bars represent standard deviations.