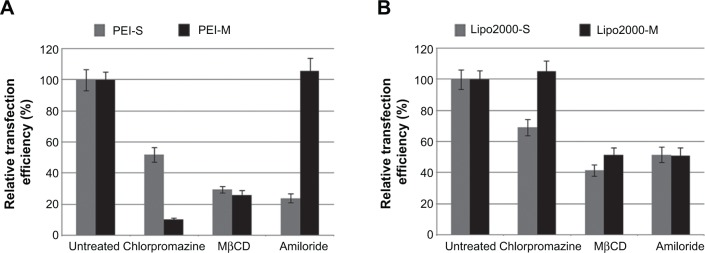
Figure 7.

Analysis of relative transfection efficiency after the inhibition of specific pathways by endocytosis inhibitors. Cell line: Hep G2. Plate: six-well format. S: standard transfection. M: modified transfection. Cells were treated with inhibitors for 1 hour followed with pEGFP-C1 transfection. Proportion of enhanced green fluorescent protein-expressing cells in each group was analyzed by fluorescence-activated cell sorting 48 hours later and the data were normalized to those of the untreated group.
Abbreviations: PEI, polyethyleneimine; Lipo2000, Lipofectamine™ 2000; MβCD, methyl-β-cyclodextrin.
