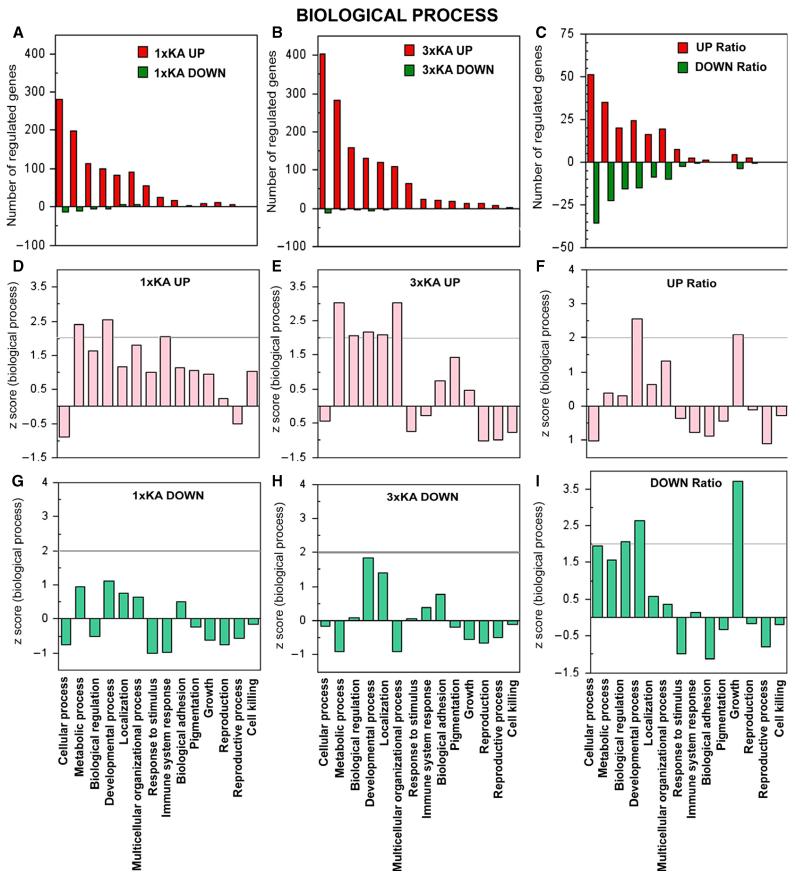
Fig. 2.
Ontology of genes regulated within biological process. (A–C) Bar graphs show number of genes (red) upregulated and (green) downregulated by ≥ 2-fold 72 h after status epilepticus. (A) 1 × KA vs. Control. (B) 3 × KA vs. Control. (C) 3 × KA vs. 1 × KA. (D–I) Graphs illustrate Z-scores (extent to which a certain function is significantly over- or under-represented) for genes up- or downregulated. (D) After 1 × KA, metabolic and developmental processes and immune system response were most over-represented. (E) After 3 × KA, metabolic, developmental processes and multicellular process were most over-represented. (F) The ratio revealed that differentially upregulated genes within developmental process and growth categories continued to be significant. (G and H) After 1 × KA or 3 × KA, downregulated genes did not reach statistical significance within any category of biological process. (I) The ratio revealed differentially downregulated genes under biological regulation, developmental process and growth.

