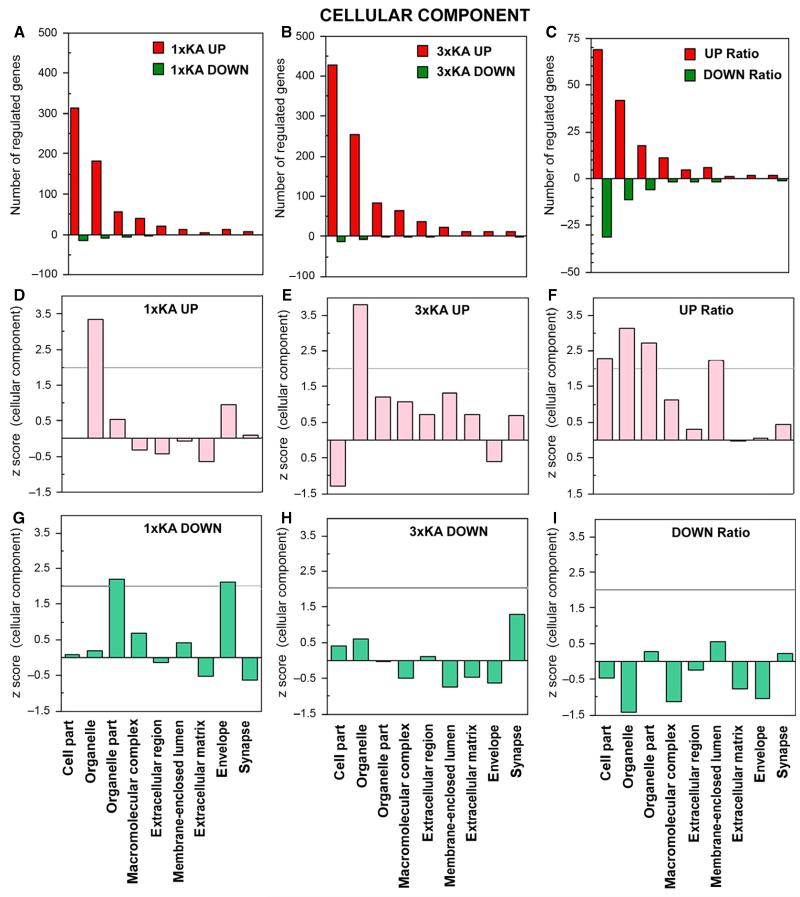
Fig. 3.
Ontology of genes regulated within cellular components. (A–C) Bar graphs show number of genes up- or downregulated by ≥ 2-fold 72 h after status epilepticus, with and without a history of two neonatal seizures. (A) 1 × KA vs. Control. (B) 3 × KA vs. Control. (C) 3 × KA vs. 1 × KA. (D and E) Graphs show that the only significant positive Z-score was found within the organelle category following either 1 × KA or 3 × KA. (F) The ratio revealed differentially upregulated genes within cell part, organelle and organelle part, and membrane-enclosed lumen. (G) After 1 × KA, significant positive Z-scores among downregulated genes were found within the categories organelle part and envelope. (H and I). No significant Z-scores for downregulated genes were observed under this ontology after 3 × KA or after calculating the ratio of 3 × KA/1 × KA.

