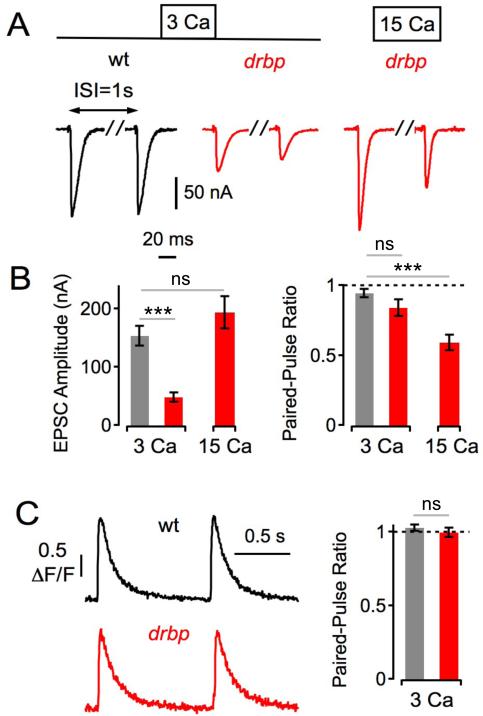
Figure 7. Slow Recovery From Synaptic Depression after Single-AP Stimulation in rbp.
(A) Representative EPSCs in response to paired-pulse stimulation at an inter-stimulus interval (ISI) of 1s of the indicated genotypes and [Ca2+]e.
(B) Average first EPSC amplitudes (left) and paired-pulse ratio (EPSC2/EPSC1, right) of wt (3 Ca: n=8), drbp (3 Ca: n=8; 15 Ca: n=5). Note the similar first EPSC amplitudes (p=0.21), and the significant difference in paired-pulse ratio (p<0.001) between drbp at 15 Ca and wild type at 3 Ca.
(C) Left: Example spatially-averaged Ca2+ transients of wild type and a drbp induced by paired-pulse stimulation at an interval of 1s (average of 7–10 scans each; 3mM [Ca2+]e). Right: Average Ca2+-transient amplitude paired-pulse ratio (ΔF/F2/(ΔF/F1)) of wild type (n=11) and a drbp (n=12). Note that we did not detect significant differences in baseline ΔF/F (wild type: 1.29 ± 0.11; drbp: 1.37 ± 0.0; p=0.52), and baseline fluorescence (p=0.99) at this [Ca2+]e (see also Figure 6B).

