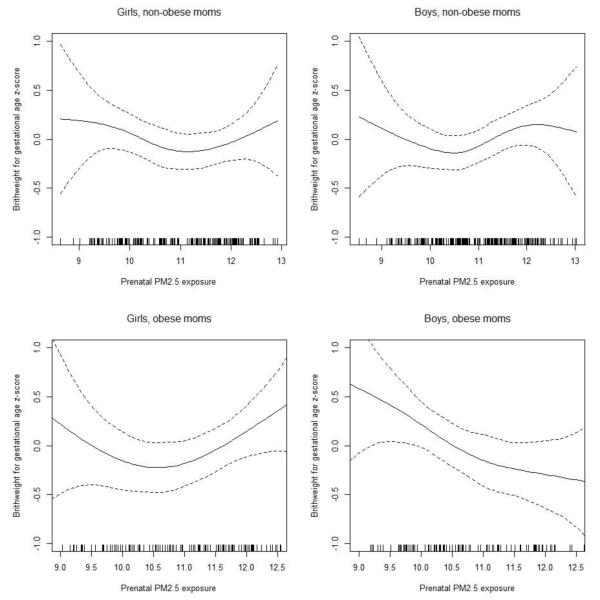
Figure 3. Exposure-response relationships between prenatal PM2.5 level and BWGA z-score.
Penalized spline curves demonstrating the relationship of prenatal maternal exposure to PM2.5 with BWGA z-score, stratified by sex and maternal pre-pregnancy obesity. Solid line depicts the penalized spline curve while dotted lines indicate the 95% confidence bounds. Models were each adjusted for season of birth, maternal race, education, age at enrollment, prenatal smoking, prenatal NLEs, and neighborhood disadvantage index.

