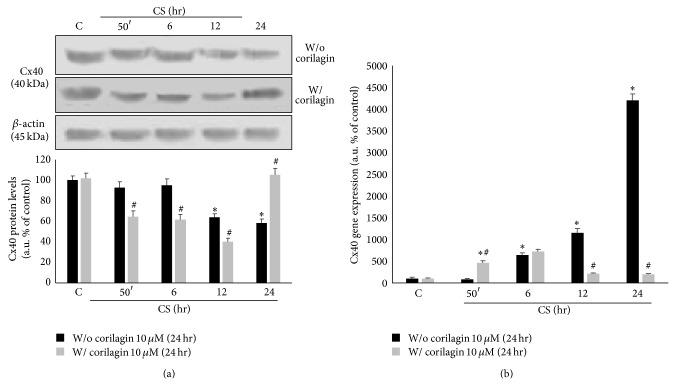
Figure 8.
Corilagin reestablishes connexin 40 protein and gene levels after CS exposure. WBs in the top left panels are representative of five independent experiments. Bands quantification is shown in the bottom left panel (a). β-actin was used as loading control. Gene expression is shown in the right panel (b). Data are expressed as arbitrary units (average of five independent experiments; P < 0.05); ∗ versus 0 hr w/o corilagin 10 μM (24 hr); # versus w/o corilagin 10 μM (24 hr).

