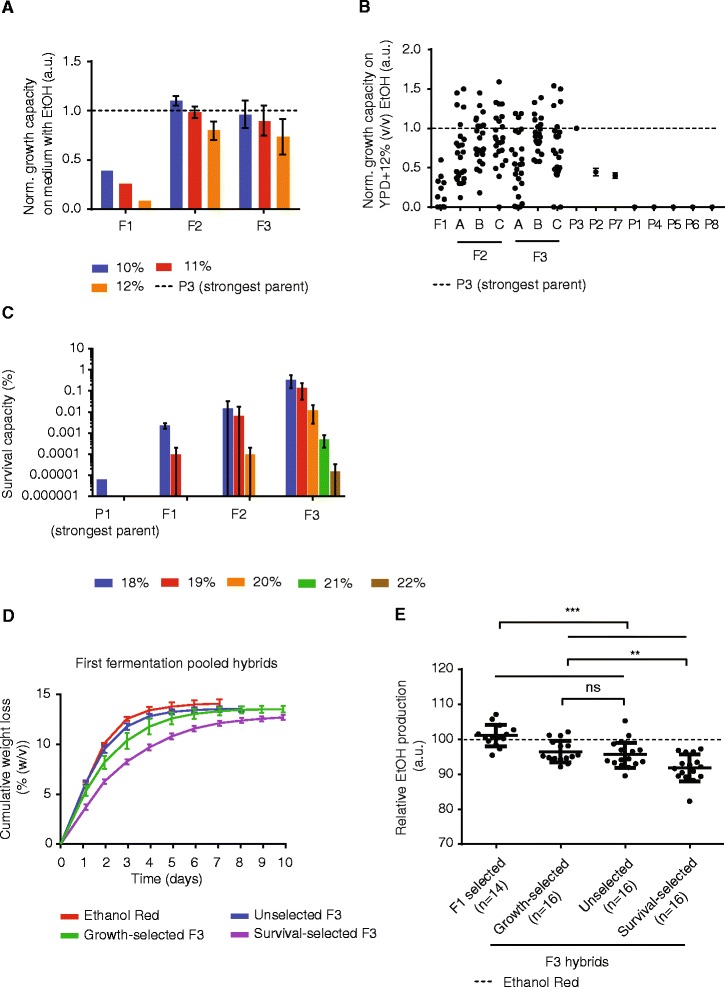
Figure 3.

Genome shuffling based on random mating generates hybrids with increased ethanol tolerance. (A) Growth capacity in the presence of ethanol of clones obtained before selection (F1), after one round (F2) and two rounds of shuffling and selection (F3). Whereas F2 hybrids show a clear increase in growth capacity, F3 hybrids do not show further increases. (B) Same data as Figure 3A for the individual isolates at 12% (v/v) ethanol and the parental strains (n = 2 for each parent). F2 and F3 isolates on average performed better than F1 isolates, but did not show statistical differences between different replicates and generations (unpaired t-test P > 0.05). A, B, and C are biological replicates. (C) Selection for survival in high ethanol yields hybrids with increased survival capacity which further increases after each round of shuffling. Each bar represents the average and standard deviation of three biological replicates, except for F1 19% (v/v) where n = 2. Survival after exposure to 21% (v/v) and 22% (v/v) was only measured for F3 populations. The data for the strongest parental strain (P1) is displayed for 18% (v/v); this strain completely lost its viability after exposure to 19% (v/v). (D) Fermentation performance of F3 populations in YP + 35% (w/v) glucose. The cumulative weight loss, a proxy for CO2 production, during the fermentations is shown. Each line represents the average of two replicate fermentations for the reference strain (Ethanol Red), six replicates for growth-selected and survival-selected populations, or twelve replicates for unselected populations. Error bars represent standard deviations. (E) Selected isolates from several pools of hybrids were tested for their maximal ethanol accumulation in YP + 35% (w/v) glucose. On average, F1 hybrids showed the highest average ethanol production levels. Unselected and growth-selected F3 hybrids on average performed similar, but better than survival-selected F3 hybrids. The dotted line indicates the ethanol production of Ethanol Red. Unpaired t-test: ns, not significant; **P ≤ 0.01; ***P ≤ 0.001.
