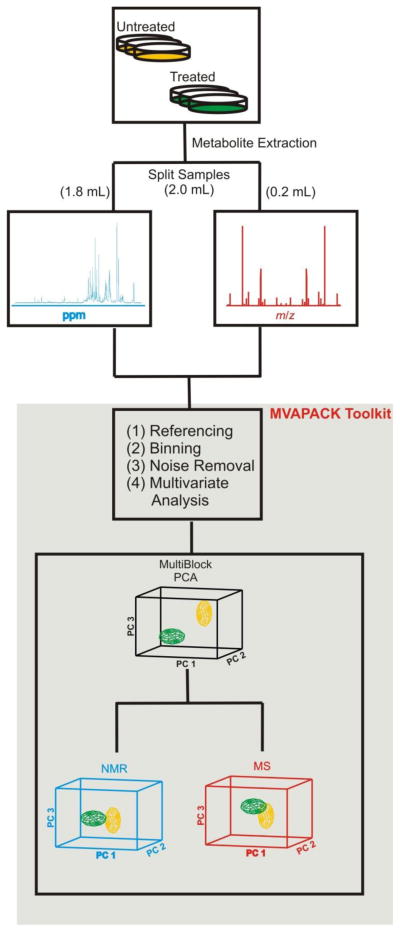
Figure 1.
A flow chart illustrating our protocol for combining NMR and MS datasets for metabolomics. A) 2.0 mL of a single metabolite extract was split into 1.8 mL and 0.2 mL for NMR and MS analysis, respectively. B) Spectral binning of the NMR data used adaptive intelligent binning. First, the background is subtracted from the MS spectrum followed by spectral binning. Spectral binning of the MS data used fixed binning with a set bin width of 0.5 m/z. C) Baseline noise removal and normalization separately applied to the NMR and MS data sets. D) The NMR and MS datasets were modeled by MB-PCA and MB-PLS. E) The resulting block scores and loadings were analyzed for significantly contributing metabolites.

